
A Century Of UK/NI Rainfall (part 4)
A butcher's at drought and deluge over the last 100 years. Are things getting worse, and what does ‘worse’ even mean?

In my previous post in this series I lamented lack of crayoning something as simple of mean daily rainfall owing to data quality issues. We noted that from February 2009 onward the crew at NOAA have erroneously coded the soil temperature at 100cm as minimum daily air temperature and PWS hydrometeor codes as millimetres of rainfall at a globally significant weather station (Armagh). I promised to go check the remaining long series stations in my sample and I did just that.
Rain Check
A quick reminder of the UK/NI stations in my long series sample:

A simple A-Z sort order on the rainfall field provided a list of dates of outliers to check at every station. These daily values (as pulled down from GHCNd via KNMI Climate Explorer) were compared to original station records using MIDAS data held in the CEDA Archive in combination with this fantabulous resource run by Met Éireann.
Looking Good
It’s another fine summer morning out there and I am pleased to report that all extreme outliers for daily rainfall that were examined passed validation with flying colours. This is worth a modest treat or two; a slice of light lemon sponge, perhaps.
There’s A Hole In My Bucket
One thing that still concerned me was all those missing values that were tabulated back in part 1. Armagh led the way with 1,362 missing daily records in a period of 360 months, with Cambridge NIAB coming a close second at 1,336 missing records. Were these stations really that sloppy? Was there a hole in NOAA’s ark or just a dent in KNMI’s bucket?
Here’s the KNMI plot for daily precipitation at Cambridge NIAB:
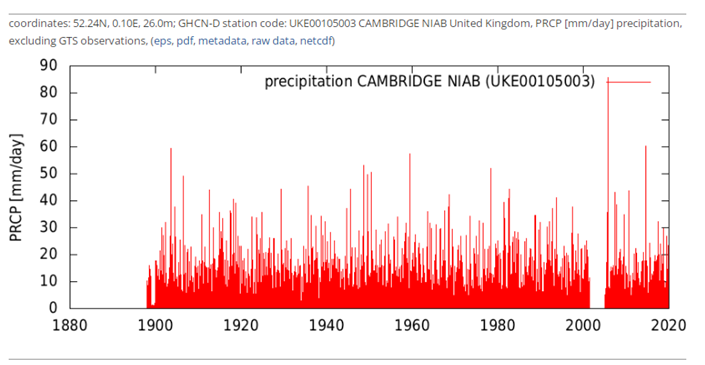
See that hole that stretches from June 2001 to December 2004? Well, that hole doesn’t exist in the station record held within the Met Office Integrated Data Archive System (MIDAS) for land surface station data that can be accessed from within the CEDA Archive. You can check this for yourself by downloading the data from here or you can squint at this screenshot of early 2002:
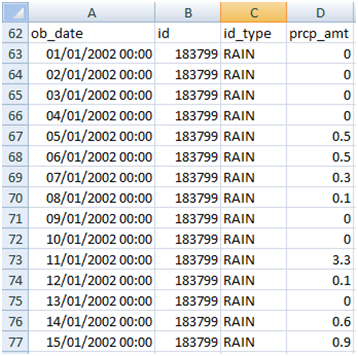
Cambridge NIAB measured 3.3mm of rain on 11/1/2002 that doesn’t appear in the KNMI GHCNd download record, but who and what to blame the NOAA crew or KNMI software?
I’d Like Some Data Please!
NOAA are very good at dishing out freebie data, so I took my bowl and asked for some more…
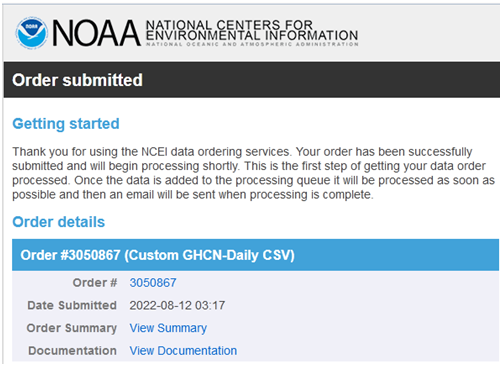
In the flashest of flashes this CSV for daily precipitation at Cambridge NIAB over the period January 2001 - December 2005 is what they sent back. If you open this you’ll find the dirty great hole as faithfully reported by KNMI’s Climate Explorer; herewith a screenshot:
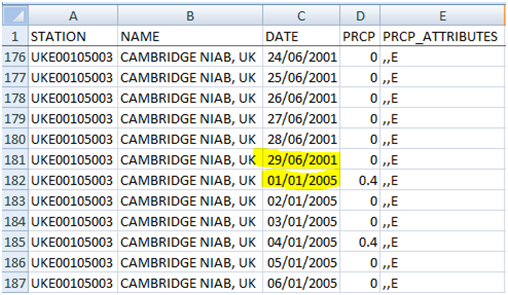
In informal North American I shall declare this as NOAA’s bad.
Does NOAA Get Anything Right?
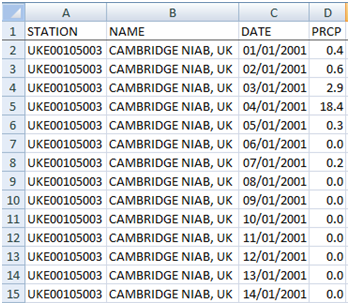
Whilst my tea was brewing I decided to peer at daily rainfall records at Cambridge NIAB for the first 14 days of 2001. Here’s NOAA’s version of events:
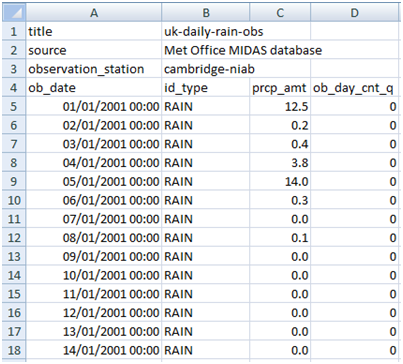
And here’s the UK Met Office MIDAS version of events:
I think we’re allowed to swear at this point!
An Idea
There are two observatories in this part of the world that often get confused: Cambridge NIAB (MIDAS 455/UKE00105003) and Cambridge Botanic Garden (MIDAS 454/UKE00105648). Herewith the MIDAS record for the latter:
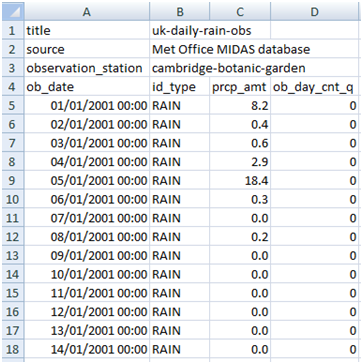
Something rather intriguing is apparent in that the NOAA daily values for Cambridge NIAB exactly match the MIDAS Botanical Garden garden record for the day after! What kind of foul sorcery is this? Not only have NOAA confused two stations but they’ve displaced data records by one day. This is bizarre!
MIDAS & NOAA Head-To-Head
When it comes to accurately archiving UK weather data my money (all of my money) will be placed on the official Met Office values within the MIDAS system. At this point I didn’t trust NOAA to get anything right so I pulled down rainfall and air temperature records for both Cambridge NIAB and Cambridge Botanical Garden from MIDAS/NOAA for 2001.
N.B. At this point it is worth noting that MIDAS holds only rainfall records for Cambridge NIAB.
I’ve boiled all the data into a self-explanatory spreadsheet which may be obtained from here. Herewith a screenshot of the first 14 days of 2001:
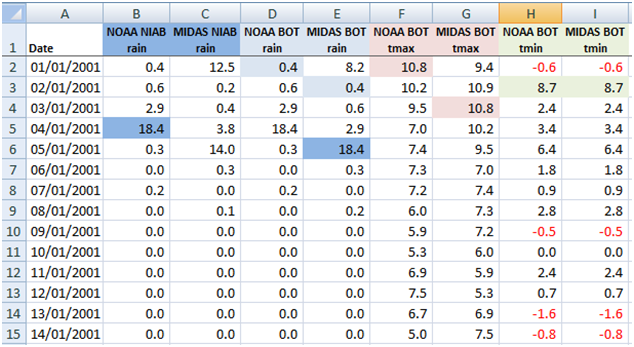
We now see that NOAA’s NIAB rainfall series is not based on NIAB’s actual rainfall series but on the Botanical Garden data with a 1 day phase shift. NOAA’s Botanical Garden rainfall series is based on actual Botanical Garden rainfall but with the same 1 day shift.
When it comes to temperature there’s good and bad news. The good news is that NOAA’s Botanical Garden minimum daily temperature series is based on the real thing on the same day. The bad news is that NOAA’s Botanical Garden maximum daily temperature series is based on the real thing but shifted by 2 days.
What kind of numbskull coding confuses rainfall from two different stations that then goes on to yield two different data capture lags? Is this wacko issue isolated to just Cambridge over here in the UK or is NOAA’s global cupboard full of similar skeletons?
The Stable Door Is Now Open
I shall test matters by having a jolly good look at Oxford’s exemplary record, being ancient rivals in the matter of the boat race. The trouble is, even if NOAA has nailed Oxford’s data record to perfection, we can’t then assume this level of quality applies to the many thousand stations in NOAA’s larder. I’m afraid the horse has bolted and it has left behind a steaming gift.
Kettle On!
I voted to focus on COVID, but this work is an eyeopener. UNBELIEVABLE! And which data bases are Prof Moriaty and ilk using to justify the multi gazillion dollar spend on "man-made global warming"?
Mistakes happen, which is why Quality Control exists. These guys do have QC don’t they?
(All your dodgy-data discoveries really remind me of troubleshooting financial spreadsheets at work!)