A Century Of UK/NI Rainfall (part 1)
A butcher's at drought and deluge over the last 100 years. Are things getting worse, and what does 'worse' even mean?
A few days ago I drove Mrs Dee down through the verdant county of Somerset, the land of dragons, cider and tractors (except we call them trakkurs down here). Wishing to avoid the caravan-laden M5 we decided to meander using the old trunk roads that took us through the sprawls of Highbridge, Bridgwater, North Petherton and Taunton. What struck us was the sheer scale of new residential build on the outskirts of these towns. We’re talking thousands and thousands, all of which will require a water supply.
With no plans for new reservoir and water treatment build evident in the local press (more importantly in the pub talk amongst farmers) I wondered how that additional demand would be met, and figured that water shortages might be a feature of UK life in the next decade regardless of our infamously wet weather. No doubt they’ll blame it on climate change.
So let’s get ahead of the alarmist UK press who are at this very moment poised to strike the public down with fearful headlines of hosepipe bans and promises of worse things to come. Is Armageddon really around the corner and will it involve sharing a bath?
Method
There’s an awful lot of weather stations in the UK and Northern Ireland but not all of them measure rainfall. Many were not in existence 20 years ago let alone 100 and so to avoid sample bias we really ought to select stations whose bucket has been out continuously for a serious length of time. I thus decided to interrogate the Global Historical Climatology Network Daily database (GHCN-d) using an extremely useful interface established by the Royal Netherlands Meteorological Institute (KNMI).
Station Sample
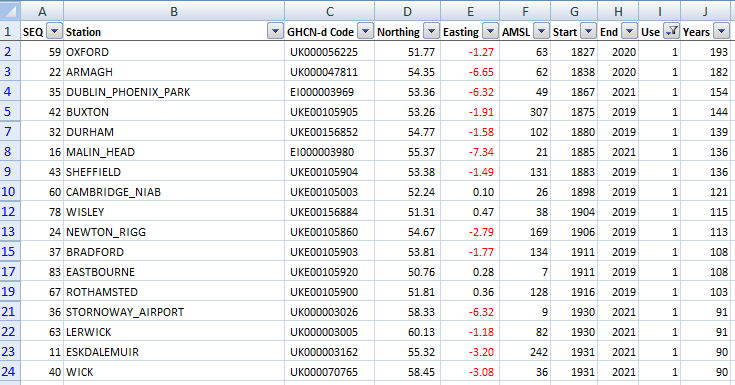
It transpires that only 13 GHCN-d stations in the UK and Northern Ireland have been collecting rainfall data continuously for 100 years with accessible records to 2019 and beyond. Herewith a screenshot of my spreadsheet:
Before we get stuck in to plotting mean daily rainfall from 1827 to 2021 we need to know what our mean means. In this instance the mean starts life as the arithmetical mean (a.k.a average) of all 13 stations in the sample, this being derived on a day by day basis. The fly in the ointment here is that not all stations will have been recording rainfall every day without fail since 1827.
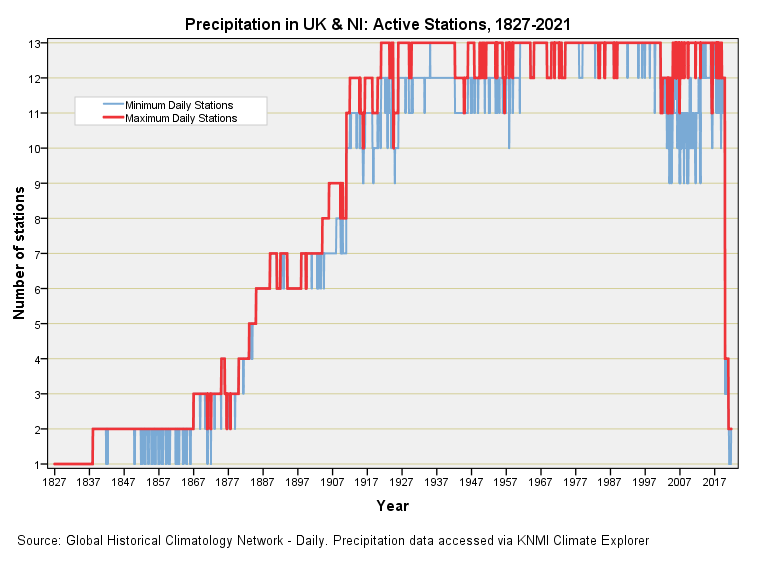
Indeed so, for we find Rothamstead didn’t get its bucket out until 1916, so 1916 would be a sensible start point for our time series if we want continuity to spread through our analysis like warm butter through our sponge mix. We might consider the possibility of stations dropping in and out of the sample as time passes and we’d be right. Here’s a plot of active stations putting buckets out each month over the period 1827 - 2021:
It’s clear we are going to have to axe the most recent data with December 2019 being the last month that saw 12 of the 13 stations think about their bucket. Anything after this is likely to introduce sample bias and, unlike the Met Office, I’m a bit sniffy about that. Our sensible starting point of 1916 still appears to be sensible with 11 of the 13 stations remembering their buckets.
There’s a bit of bother that marks both world wars, with the minimum monthly active station count dropping a little during these two periods. Quite what the even bigger bother was around 2007 is anyone’s guess. Are we looking at funding and/or resource and/or maintenance issues? A deliberate attempt at fudging the record, perhaps? Something else entirely?
A Touch Of Frost
Wiki tells us that Detective Inspector William Edward "Jack" Frost, in the popular UK TV series A Touch Of Frost, was an experienced and dedicated detective who frequently clashed with his superiors. I can relate to this.
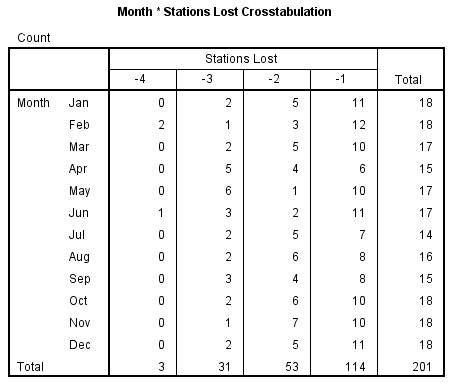
If fudging the record was indeed the dastardly motive then we might expect to see stations dropping out of the sample with some sort of monthly pattern. We can determine this by calculating a series for stations lost and having a look at the 30-year period 1990 - 2019:
In the above table we find February is the leading month for knocking out 4 stations and I would suggest this is due to the white stuff and weather that is literally freezing the brass bits off the buckets. In contrast April and May are the bullies when it comes to knocking out 3 stations and this is most curious. We can’t go blaming this on extreme weather, so why did these stations stop recording rainfall during months noted for rainfall? It’s time to bring the suspects in for questioning!
Where were you at the time of the data loss?
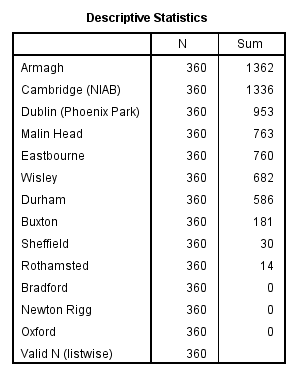
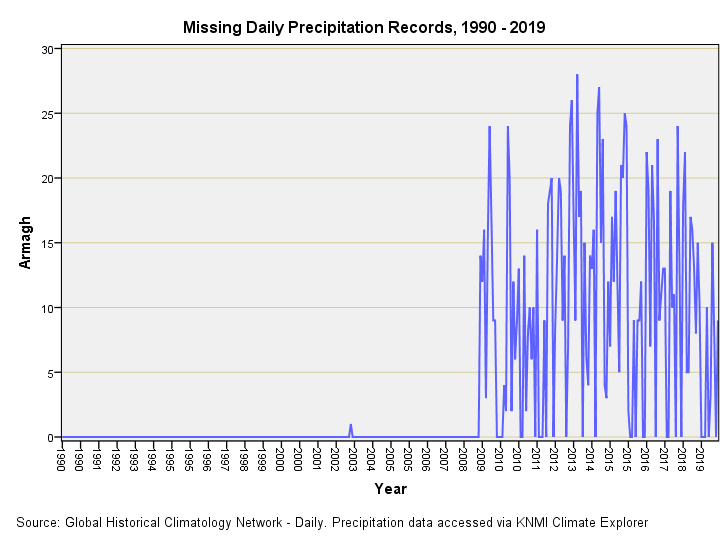
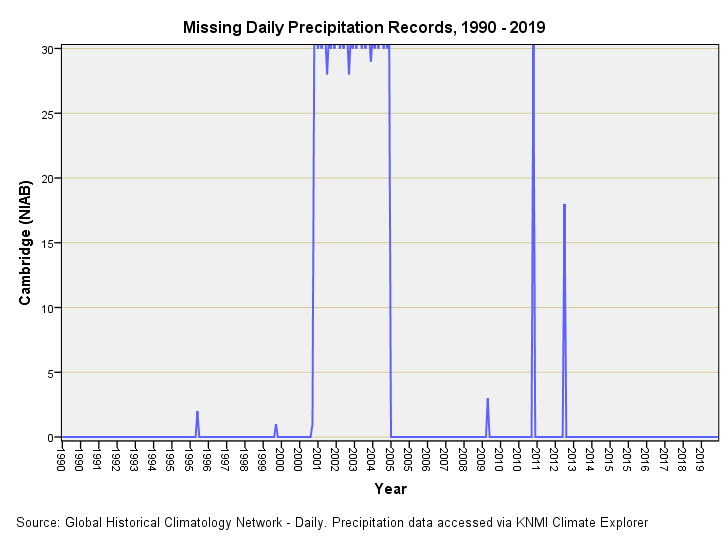
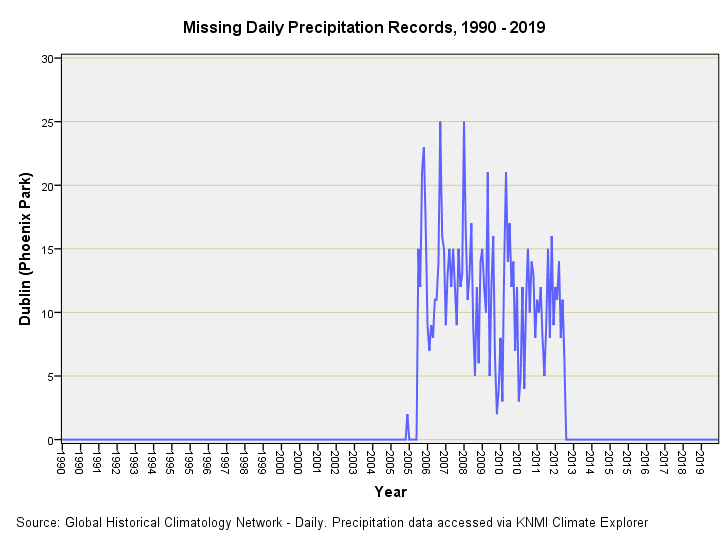
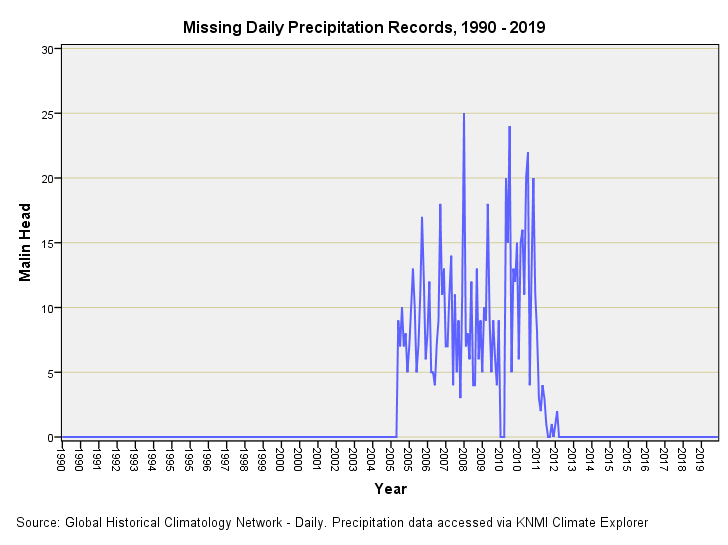
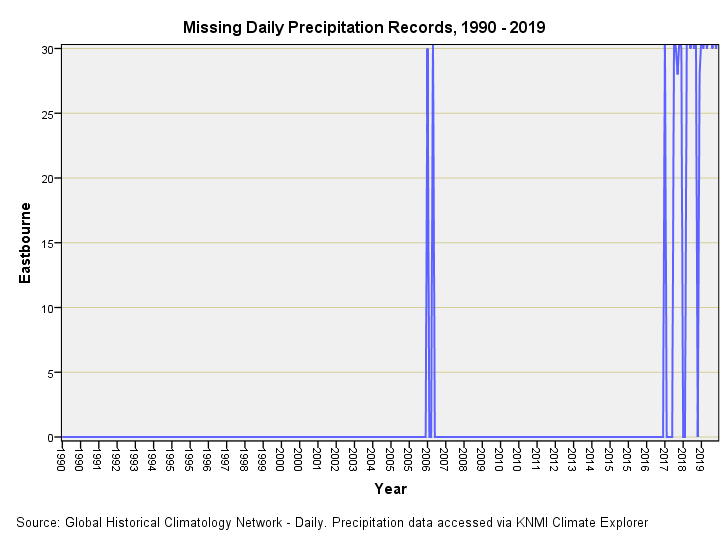
Let’s start with a listing of missing daily precipitation records by station for the period 1990 - 2019:
Oh dear, oh dear. I see that Cambridge NIAB is up there with Armagh for forgetting to put their bucket out, with 1,336 bucketless days in 360 months. That’s rather remiss for a botanical research centre, but they seem to make up for it by focusing on record temperatures (see this newsletter). In contrast Oxford’s historic precipitation record is exemplary, as is Newton Rigg’s (though I should say was - see the sorry story unfold here), and Bradford’s (well done Chris Russell). So let’s put the top five suspects under the spotlight…
There’s clearly something funky going on with the 3 stations in Northern Ireland, and Cambridge NIAB clearly had data collection issues back in 2000 - 2005. Eastbourne seems to have recently lost its bucket.
What To Do?
If I worked for the Met Office I’d ignore all these wrinkles and produce a nice plot of mean daily rainfall for the period 1916 - 2019 here and now. My inner geek won’t allow this and so I shall set about constructing a mean with meaning only after I’ve finishing this spot of sleuthing. I therefore suggest we get our kettles on and brew some strong coffee - we may need it!
Kettle On!


Fascinating odd gaps you’ve turned up there. I really want to know what’s behind them now.