
A Century Of UK/NI Rainfall (part 3)
A butcher's at drought and deluge over the last 100 years. Are things getting worse, and what does ‘worse’ even mean?

You’d think by now that I’d be able to get my crayons out and at least draw a chart of mean UK/NI rainfall since the turn of the last century. We’ve got naughty NOAA to thank for that; plus, just when I thought I’d cracked the problem with the wonky rainfall record at Armagh (whose historic data series is significant on a global scale), along comes an eagle-eyed subscriber to point out the minimum daily temperatures were higher than maximum for the early part of February 2009. Let’s just squint at these again…

Fine. Right. Obviously something wacko is going here that is more than getting the decimal point wrong, and my money is on NOAA being sloppy and not the fine crew at Armagh. This nudged me into working my way through the fabulous CEDA Archive to find the actual automated observations, which may be found here.
That sequence of 44,44,44,44,43,43 for minimum temperature in Fahrenheit looked suspicious to me so I searched for the Centigrade equivalent (6.6 etc) and found them under this column:
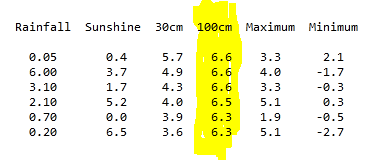
That’s right, what NOAA is using for daily minimum air temperature is the soil temperature at 100cm. Fine. Right.
N.B.The actual and genuine daily minimum air temperature with no added nonsense are those numbers on the right and, yes, NOAA managed to get the maximum temp figures right.
So What About Armagh Rainfall?
At this point I didn’t trust NOAA’s version of Armagh’s rainfall data one millimetre. Here’s a snap of my spreadsheet to remind us how bizarre this is:
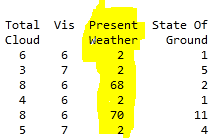
Guess where I found the data sequence of 2,2,68,2,70,2? That’s right, I found this data sequence under the column headed ‘Present Weather’. Obviously. Fine. Right…
What Does Present Weather Mean?
Present weather requires a present weather sensor (PWS). Wiki tells us that this is a device that detects the presence of hydrometeors and determines their type (rain, snow, drizzle etc). In plain English these are particles of liquid or solid water from fine mist to hailstones the size of Texas that pass through the atmosphere. You detect them using an optical method (infrared LED or radar) which gives a coded readout as to hydrometeor class.
What we are looking at in the table above is a string of PWS codes that tell us: unchanged,unchanged,slight rain with snow, unchanged,intermittent slight snow, unchanged. This data column does not tell us anything about rainfall measured in a bucket in millimetres!
Summary
Since February 2009 the crew at NOAA have erroneously coded the soil temperature at 100cm as minimum daily air temperature and PWS hydrometeor codes as millimetres of rainfall at one of the world’s most important weather stations (Armagh). This is worth a face palm and perhaps some jeering.
My concern now is that a coding cock-up this calamitous may apply to data from other UK stations (and elsewhere) and so I shall get the big pot brewing, I shall roll up my sleeves and go check a whole bunch of data.
Kettle On!
Great sleuthing Holmes,, a 2 pipe puzzle?. Watson. Trillions of dollars cost based on temperatures that aren't temperatures, and mixing ground and air. Unbelievable or criminal?