The Other C-word
From COVID to Climate Change: temperature measurement at Cambridge University Botanic Garden
The UK public are quaking in their boots as the first ever red alert extreme heat warning has been issued by the Met Office, forgetting that it was pretty darn hot back in ’76 and ’47, and we somehow managed to survive those hot blasts. I don’t recall any alarmism, just ice creams melting faster and a need to sleep on the lawn at night under a damp towel.
"This is the first time we have forecast 40°C in the UK. The current record high temperature in the UK is 38.7°C, which was reached at Cambridge Botanic Garden on 25 July in 2019."
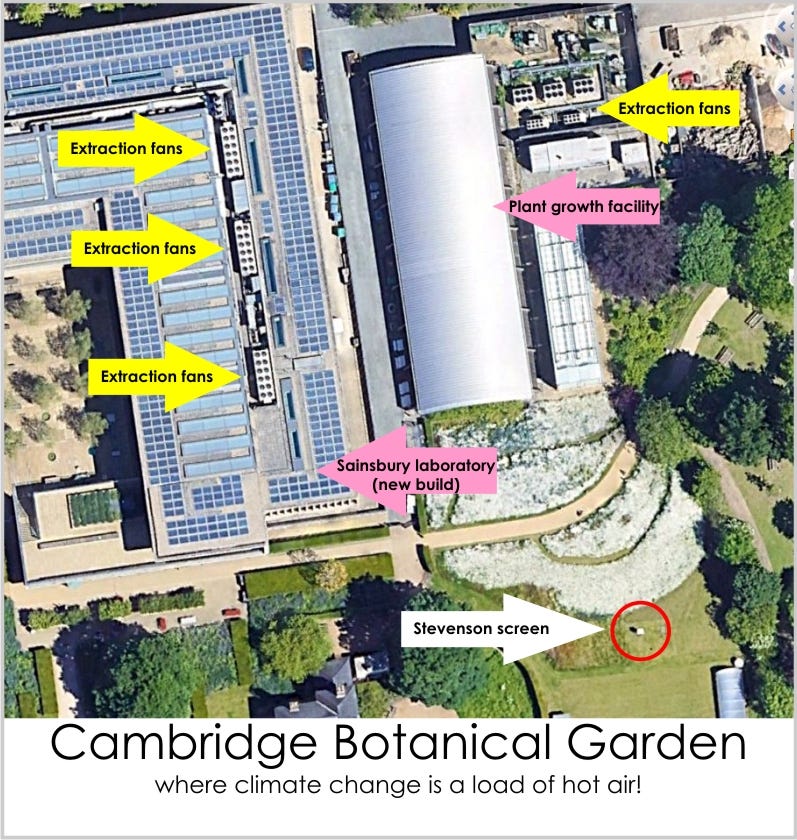
The phrase ‘Botanic Garden’ conjures a cool leafy area where air temperatures are accurately recorded by instrumentation housed in one of those pleasant Stevenson screens. No urban heat island effect there surely, by George!
We’d be mistaken in this assumption when it comes to CUBG and here’s why:
On the day of reckoning I gather that they also opened the shutters and doors of the plant growth facility (a swanky glass and timber greenhouse) to allow it to cool. Guess where all the hot air went. There's also a nice article on the CUBG website covering meteorological observation that somehow manages to avoid mentioning all these local sources of excess heat.
Are record temperature measurements a sign of things to come?
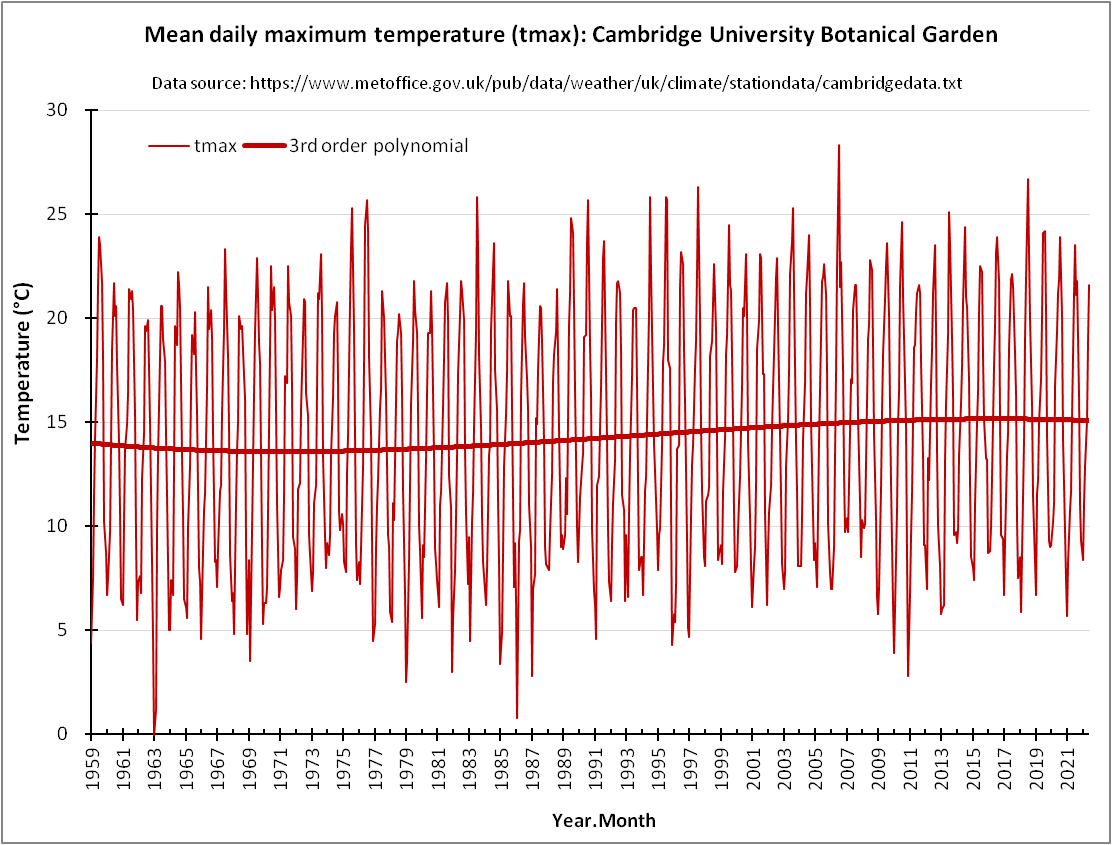
Not necessarily; it is possible to continue to observe record temperatures on a cooling planet. Whenever somebody from the Met Office stands up and declares a new record on a particular day at a particular location the public ought to ask what happened at the meteorological observatory up the road, and they also ought to ask what happened on the day before. Ideally they’d ask to see something like this:
Here we have the series for mean daily maximum temperature (tmax) as recorded within the CUBG Stevenson screen since 1959. You can download this data here. The meaning of the ‘mean’ is that the Met Office take all the maximum daily readings and average them over the month. We thus see that the current UK record of 38.7°C on 25 July 2019 at CUBG got buried in a pile of so-so maxima for the rest of that month.
Polynobblies
I don’t know about anybody else but my eyeballs find it hard to detect a significant warming trend, so I’ve added a low order polynomial just to give some clue as to what might be happening beneath seasonal variability. There does indeed appear to be a slight increase over time, but then again there also appears to be a cyclical component.
We can pin these variations on climate change if we fancy but in reality we don’t know what development of Cambridge University and/or the city of Cambridge has brought to the table over the years by way of an increased urban heat island effect. The substantial Sainsbury Laboratory wasn’t there back in 2007, and we must expect this building and attendant activities to have some impact given its proximity to the Stevenson screen.
The Yellow Thing In The Sky
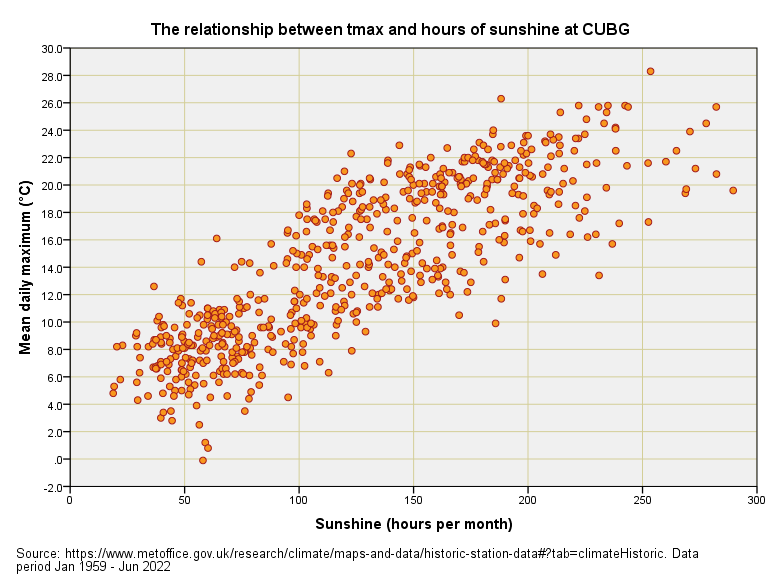
Daily hours of sunshine have a miraculous effect in that they cheer people up and are associated with higher temperatures. Until recently it was possible to download monthly hours of sunshine as well as mean daily maximum temperature for CUBG but this came to a halt in June 2010. This is a shame because one of the fundamental things we have to consider is whether variation in cloud cover is impacting on global temperature. Until we account for this we cannot say anything sensible about greenhouse gases (unless we are being paid to do so). You can try a similar experiment at home by opening and closing the curtains/blinds on a sunny day and timing how fast a bowl of ice cream melts under both conditions.
When it comes to climate science (the most settled of settled sciences, apparently) the miracle of clouds and their modulation of global temperature tends to draw dirty looks much like mention of natural immunity in COVID-world. Have a lick of this…
The Blip On The Radar
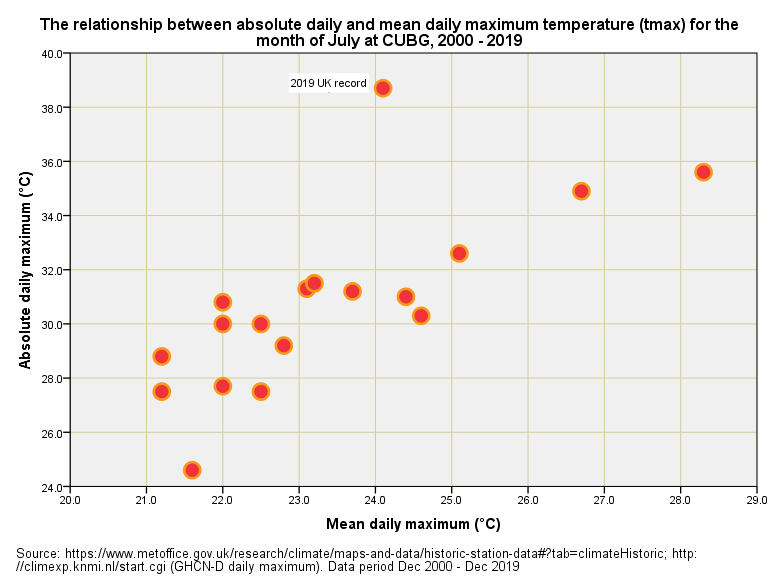
We have seen the blip that was 38.7°C on 25 July 2019 merge into a so-so monthly mean maximum temperature for 2019. In order to avoid mowing the lawn at this point I decided to download GHCN-D absolute maximum daily temperature data for CUBG, which may be more easily obtained here than NOAA. What we can now do is run out a scatterplot of absolute daily maxima against mean daily maxima (tmax) for each month of July for the period over which the GHCN-D data are available (Dec 2000 – Dec 2019). This yields a rather pleasing result:
We can now clearly see that record of 38.7°C sitting proud like the blasted outlier it actually is!
We may deduce from this that something unusual happened on 25 July 2019 that wasn’t part of a general trend and thus unlikely to be a function of a slowly changing global climate. My money is on hot air from the Sainsbury Laboratory and Plant Growth Facility blowing over the sensor. Either that or some students decided to have a BBQ.
Finally, if we are going to chastise the Met Heads at CUBG we also ought to chastise the Met Heads at Gogerddan, home of the Welsh late bank holiday temperature record of 28.8°C, as recorded on 24 Aug 2018 above an expanse of greenhouses. I kid you not…
Well folks, my teapot has gone cold and I fear man chores are mounting, so I better go get my apron on. I hope you’ve enjoyed this excursion into another realm of globalist fantasy.
Kettle On!


