
Climate Change & Climate Variability (part 12)
In this article I cook us a dish of HadCRUT thermidor (see what I did there?)

In part 11 of this series I promised fiddling and revelation so let’s get right down to it!
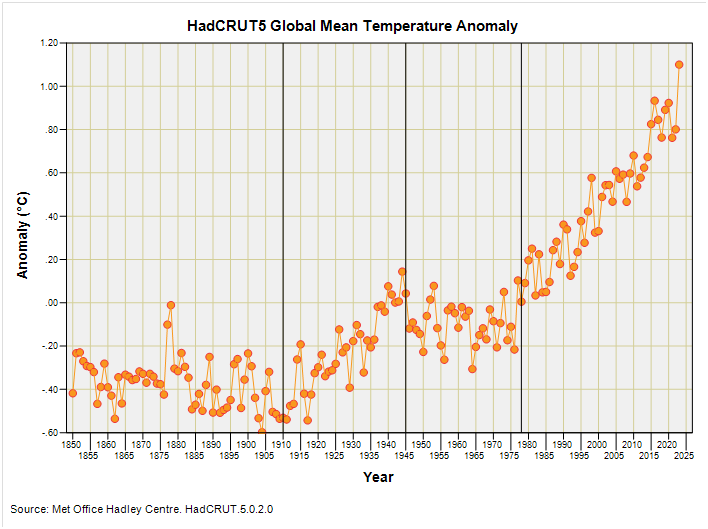
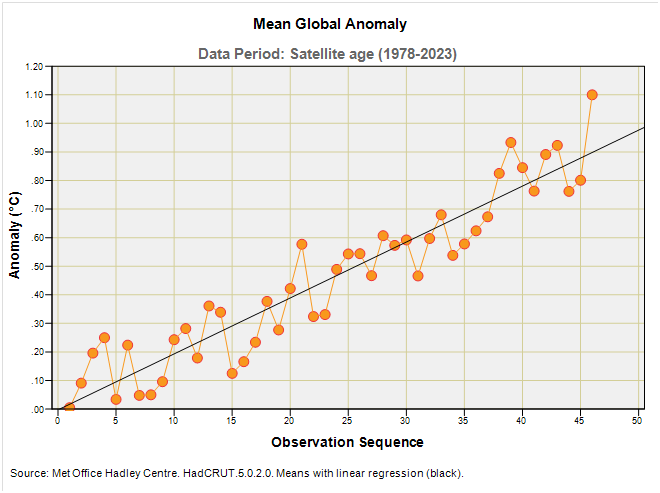
Here is the HadCRUT.5.0.2.0 annual mean global temperature anomaly, fresh out of the oven this morning. You can go and grab the very same data for yourself from here to check that I am not cheating.
I don’t know about other folk but when faced with this particular tray bake I am sore tempted to split the series into four unequal chunks using only my eyeballs and a sharp knife. You can see where I’m going to bring that knife down, and I shall serve up the following slices:
Steam age 1850 – 1909 (n=60)
Combustion age 1910 – 1944 (n=35)
Nuclear age 1945 -1977 (n=33)
Satellite age 1978 – 2023 (n=46)
Not only do these periods align with turning points that are almost certainly going to mark differing climate epochs but they also align with technological developments and sweeping changes in society. In turn these will impact on the science and the purpose of that science. Both WWII and the cold war spurred meteorology to greater heights (sometimes literally), with different data collected for different purposes to those back in the age of steam: our science and the methodologies upon which it depends do not exist in a vacuum.
Estimating The Variance Of A Squirming Series
My ancient eyeballs have seen more graphs than many folk have had hot dinners, and so it is easy for me to ogle this slide and make wild statements about the variance being invariant. By that I mean the variance of the annual estimates doesn’t change that much over time. An analogy is replacing your baggy but trendy torn and faded jeans with Spandex leggings. These are going to hug every lump and bump and bend, and so it is with this data. There’s no bagginess in this slide, no sticky out bits beyond the arms and legs, and no soggy bottom. We are talking the Hadley Centre’s equivalent of Spandex and this tells me the variance of the global mean anomaly hasn’t changed over time as we might expect if climate change is all about temperatures going wild rather than just up.
But let me formalise this with elegance, gusto and a touch of garlic…
Lobster Tails
Have you ever since a knowledgeable contestant cooking lobster tails on MasterChef? If you have then you’ll have seen them stick a dirty great wooden skewer right through the whole tail to keep it straight whilst cooking. I’m going to do the same and stick a dirty great linear regression through each of my four portions of HadCRUT5 global temperature anomaly. This is what this dish looks like:
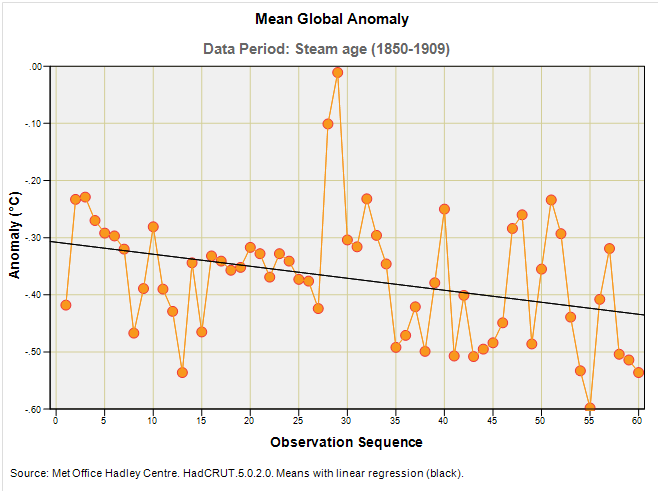
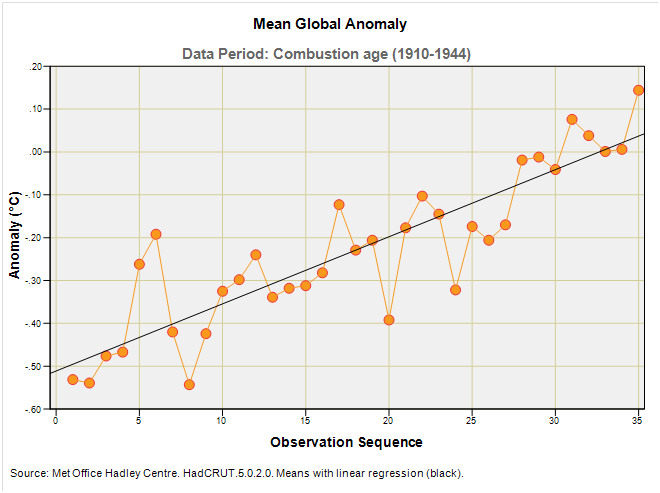
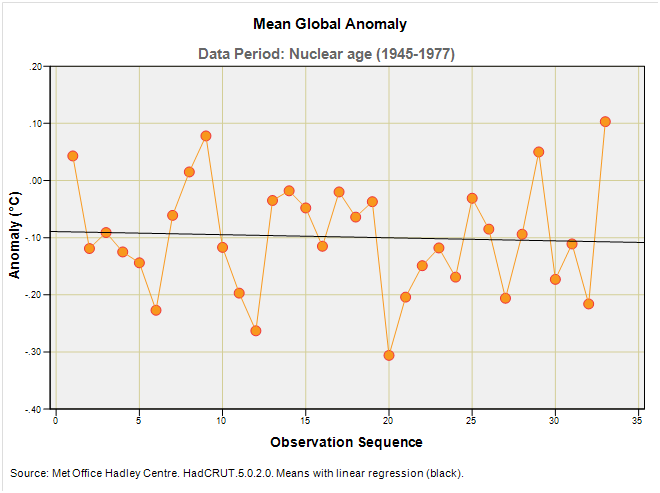
There we are! Four skewered HadCRUT tails. What I’m going to do now is pan fry them in plenty of butter to which I’ll add a bouquet garni, some paprika and a crushed clove of garlic. By that I mean I’m going to physically fit these linear regressions to the data in order to derive four portions of steaming residuals. That term ‘residuals’ sounds all fancy but all it refers to is the vertical distance between any orange blob and the thin black line.
There are those living among us who’d like to see the parameters of these four regression-skewers and here they are in a single summary table:
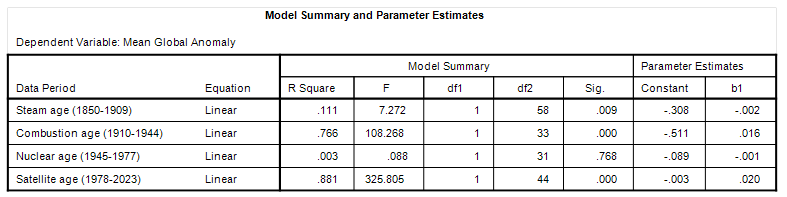
My eyeballs have rocketed right to the nuclear age, for sitting in that column headed ‘Sig.’ we find the p-value of p=0.768 which tells me there wasn’t any statistically significant warming or cooling during this 33 year period, which is an odd finding in itself given the climate crisis must have been building back then in order to deliver a front page catastrophe today.
But, hey! Forget that awkwardness! Let’s wear the right colour socks and declare warming during the combustion age estimated at 1.6°C per century (p<0.001) and warming during the satellite age estimated at 2.0°C per century (p<0.001). Let’s go throw some soup on paintings and buy a brand new EV for climate change is real, wild and deadly!
But is it really wild and getting wilder over time?
I guess we’d better go and serve up those regression-skewer residuals after gluing them all back together:
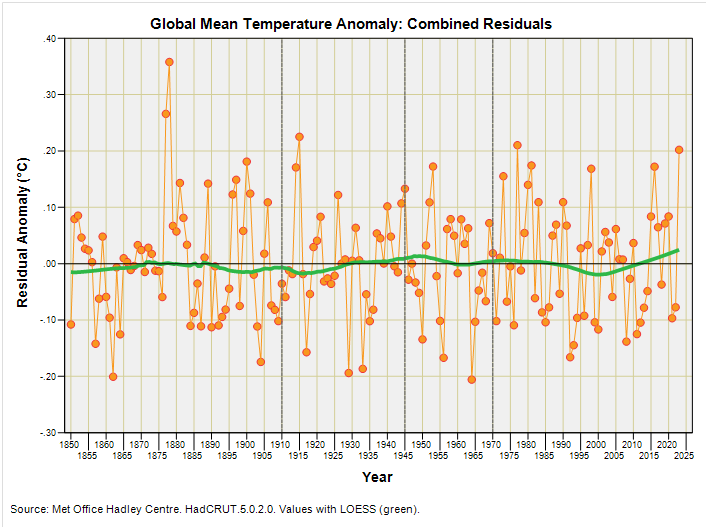
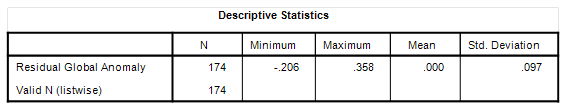
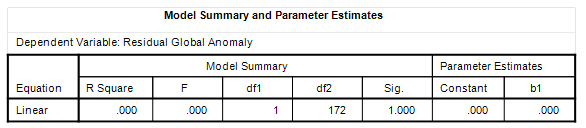
Well, well, well! There’s no escaping the fact that once we’ve accounted for the warming and cooling trends over the period 1850 – 2023 then the residual series we can derive is constant over time with a mean value of 0.000°C and standard deviation of 0.097°C. There is absolutely no hint of heteroscedasticity (increasing variance) and the series is flatter than the flattest pancake I can muster with a slope of 0.000°C per century (p=1.000).
What this means is the global mean anomaly has been observed to fall, then rise, then fall, then finally rise over a 174-year period, but at no point has the variance of this data series revealed the slightest indication of climate change leading to global temperature instability as is now being touted by fashionable alarmists.
As a genuinely alarmed alarmist you can point to periods of global warming and you can point to periods of global cooling if courageous. You can also point to alternating periods of both if you are being honest, but you cannot point to increasing temperature instability, for the variance we observe in the real world doesn’t abide by a highly fashionable narrative.
My Monkey
The temperature data that many prestigious organisations have collected these last +150 years can be used to support climate change when this is expressed in terms of global warming - as was the big MSM message that was broadcast widely only a couple of decades ago - but it doesn’t support this newfangled notion of climate change as enhanced temperature variability; that’s as plain as plain can be.
The monkey on my shoulder reckons climate change, when dressed up as variability, is a sneaky trick. The question we should all be asking (alarmists especially) is what increasingly draconian measures and policies are going to be introduced in order to control something that cannot ultimately be controlled?
Kettle On!
Strange 4 period, one inter war period. As you say no temperature instability.... key issue. I thought I'd look at HadCRUT and found it was created by The Met office and The University of East Anglia. HA! HA! Immediately totally trustful. Here's a quote from the sea temp group."The data set is presented as a set of interchangeable realisations that capture the temporal and spatial characteristics of the estimated uncertainties in the biases". Is this GOBBLEDEGOOK or has my education failed me.
Interesting info on El Nino contributing to hot 2023. https://www.science.org/content/article/el-ni%C3%B1o-fingered-likely-culprit-record-2023-temperatures?utm_source=sfmc&utm_medium=email&utm_content=alert&utm_campaign=DailyLatestNews&et_rid=701775188&et_cid=5389903