Arctic Sea Ice (part 2)
A bracing analysis of the poster child of globalist alarmism: what you always wanted to know about Arctic sea ice but were afraid to ask
In this article I’d like to introduce folk to sea ice as a seasonal phenomenon and I shall once again rely on the NSIDC error-laden passive microwave satellite data (SII) that may be found here. To do this I’m going to convert daily estimates of ice extent into monthly minima, maxima, mean and standard deviations.
We ought to start straight in with mean monthly sea ice extent for the period November 1978 – December 2022 with a red crayoned linear trendline and black crayoned locally estimated scatterplot smoothing function (LOESS):
Now that is a rather tasty bake even if I may say so myself because it gives an impression of overall ice loss over the years when set against the backdrop of seasonal ice gain and loss. If we were to extract some numbers in a rather crude fashion we could say that the maximum mean winter ice extent has generally been up at 15 million square kilometres, this dropping to 6 million square kilometres during the summer months. All in all, then, we find that the Arctic loses some 9 million square kilometres of ice in the seasonal melt each year, this representing an overall loss of 60%. If nothing else what I’d like readers to take home from this article is just how much Arctic ice is lost in the natural melt cycle each and every year!
Back in 1980 we observe the mean annual ice extent to be up at around 13 million square kilometres, this dropping to around 10 million square kilometres by 2022, representing a 3 million square kilometre loss in 42 years, which amounts to a net loss in the region of 23%. We can be pretty rough about this and state that the Arctic has lost around one fifth of its ice mass over the last four decades, with seasonal loss up at 60%. This is the sort of perspective I like to cogitate on!
Here Comes Summer
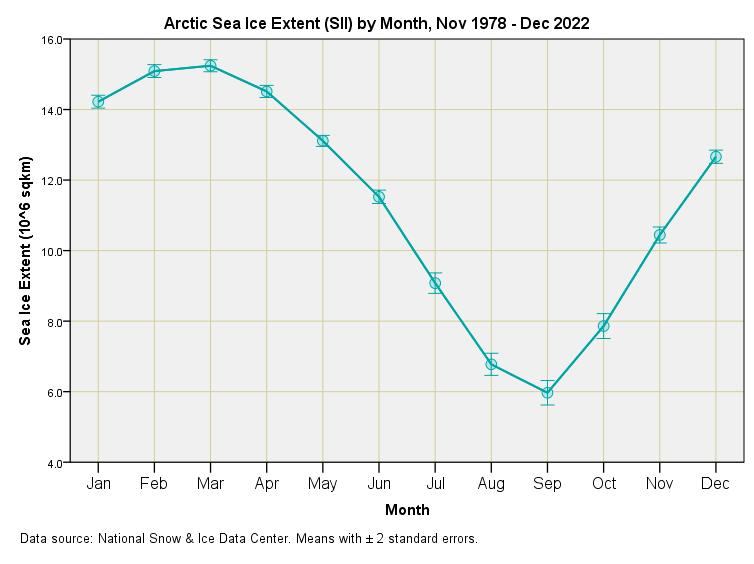
What I’m going to do now is crunch all that data together to produce an error bar plot revealing the seasonal variation. Here that is in naked simplicity:
We now get to see why Arctic ice experts like to focus on September, this being the lowest melt point in the year. Some experts also like to focus on March when ice extent is maximal. The difference between these two means fetches up at 9.274 million square kilometres, this representing a 60.8% seasonal loss.
We may use this slide to fashion a cracking tip for future eco-journalists wanting a fat pay cheque from their globalist paymasters:
Go book a cruise during March 2023 and take lots of photos of stunning ice cover in a bay that is easily recognizable from its landmarks and features.
Now go book a cruise around the same bay during September 2024 and take lots of photos of ice-free open sea.
Select the two best piccies from each expedition and place them side by side under a shocking title such as ‘Tragic Loss Of Ice In Just One Year’.
Follow this through with plenty of clichéd text that tugs on the heart strings, ensuring that your first world woke readers are ensnared in excessive ice loss guilt as they drive to Waitrose for quail eggs in their Mercedes.
Now, I realise that ‘tip’ may sound like rather vicious nonsense from the overly sharp tongue of Mr Dee but it is exactly what has been done in the mainstream media on more than one occasion. The key for exposing this kind of fraud is to obtain dates, locations and copyright credits for any and all media images concerning the Arctic – this information has to be registered with the news rag by photographers prior to publication. Never take any news item at face value!
Summer Slush
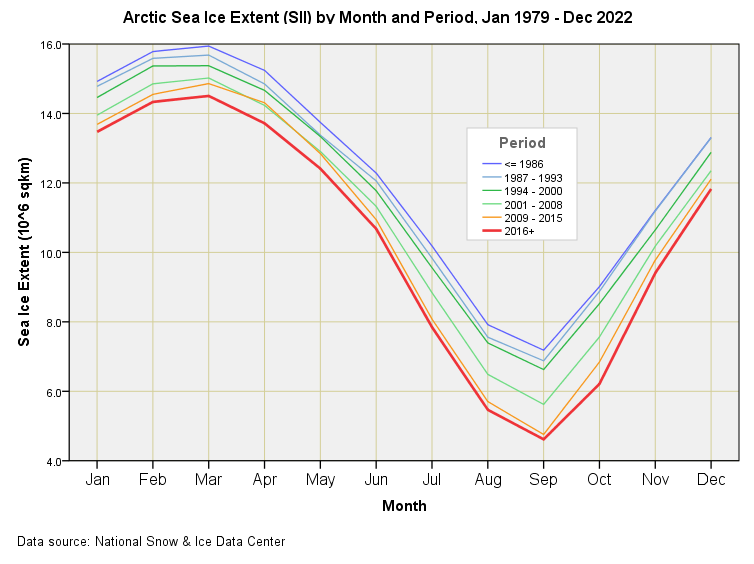
What I’m going to do now is reproduce the above slide once again but take away the error bars for clarity and plot out six lines representing monthly means for the periods: 1979 – 1986, 1987 – 1993, 1994 – 2000, 2001 – 2008, 2009 – 2015 and 2016 – 2022:
This plot is worth decent cogitation (and perhaps a fresh pot of coffee) for it reveals a couple of interesting things! The first thing we may notice is the spread between the six periods is maximal during the month of September. That is to say we see the greatest variation in historic ice loss during the month of September, this being the very month that experts like to talk about. I think we can now see why!
If we now cast our eyeballs to June or December we note that the lines are scrunched up together more so than September. These two months show the least variation over time, and are thus a poor choice for alarmists wishing to undertake historic trend analysis.
Going back to the tell-tale month of September we may also note something subtle happening in that the earliest three periods are scrunched in a bunch, and the latest two periods are scrunched in a bunch. This translates into what appears to be a temporary period of accelerated melt during 2001 – 2008 that has now slowed to a scrunch once more. Could we be looking at something cyclical?
September Song
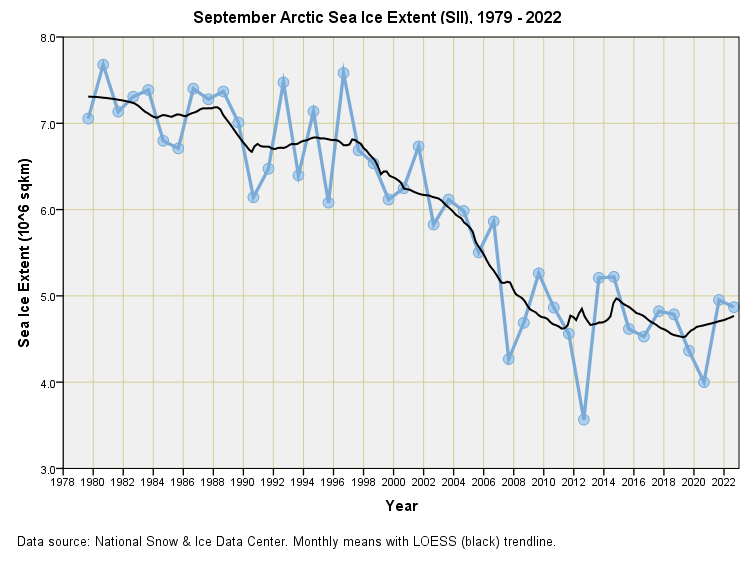
Clearly September is a most curious month all round and a particularly sensitive barometer for sea ice conditions so let us focus right in and take a look at sea ice extent for all Septembers between 1979 and 2022:
Aha! Well there you go. This slide confirms our hunch of acceleration in the autumn melt pattern that was sluggish back in the early ‘80s and is once again sluggish. In fact I’d go as far as to say the decline in the autumn melt pretty much evaporated after 2007. I confirmed this eyeballing by running a linear regression for the period 2007 – 2022, which yielded a statistically insignificant melt rate of -0.001 million square kilometres per year (p=0.968). It’s official, then, the Arctic is no longer melting away as it once did if we adopt the expert’s signature month as our yardstick!
What About Wadhams?
Back in part 1 of this series I introduced readers to Professor Peter Wadhams of Cambridge University - billed as one of the world’s leading ice experts - who frightened a lot of folk by declaring the end of summer sea ice in a series of bold media statements (herewith an example from 2012).
It was to all go by 2015-16, apparently, yet if we glance at the above slide of September sea ice (recalling that September is the maximal melt month) we clock the plain and simple fact that the rapid melt came to a standstill pretty much around the time that Wadhams was waving his hands in the air in front of eager reporters.
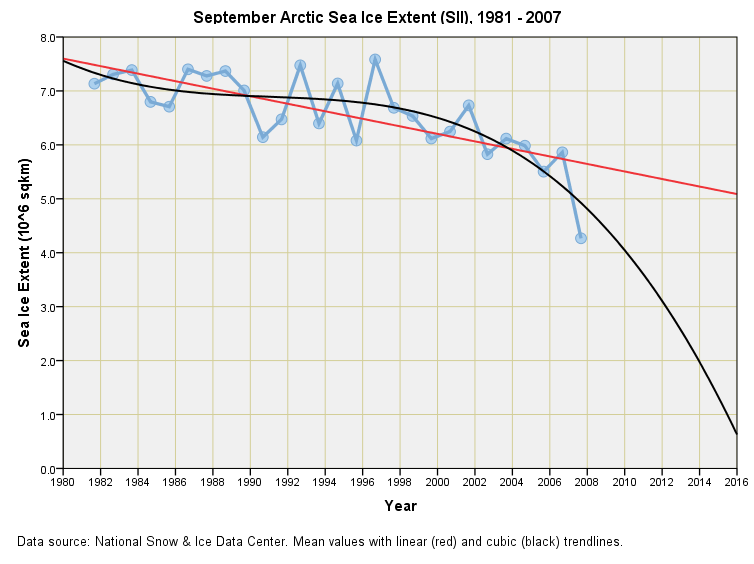
But let us give him the benefit of doubt and do the same trick of cherry picking a data period then conjuring a couple of mathematical models as I did in part 1, but this time for the month of September only. The juiciest decline I can muster is 1981 - 2007, the latter being the year in which the Professor professed his prediction. Here’s what my pair of models looks like in tabular and graphical form:
If we assume a linear melt pattern then there’s still plenty of September sea ice come 2016 so that can’t be how the Professor came to his conclusion. If we now pull a mathematical fast one and chose the very best fitting model on the grounds that it is the best fit regardless of whether the model makes real world sense, then we arrive at the cubic model (r² = 0.673) that predicts pretty much zero September ice come 2016. Crayon in the 95% confidence intervals for this model (not shown for clarity) and there you have it - a fit befitting a Professor that means nothing!
So there you go, that’s how one of the world’s leading ice experts came to be able to stand in front of a journalist back in 2012 and claim all the summer ice would be gone in four years. The most diplomatic phrase I can use to describe the Professor’s work is ‘crystal ball gazing’. And it goes on and on and on to this day.
The public are shut out of all understanding, as are politicians and journalists owing to the technical knowledge needed to fathom the claims of ‘experts’; as for people like me, well, I’m feathered and tarred as a denier, conspiracy theorist, tin-foiler or big oil operative. No doubt I also wear the wrong sort of socks.
With that I suggest we grab a slice of cake.
Kettle On!


Thanks confirms things Tony Hellyer has pointed out many times ..what I find interesting is he points out the ebb and flo of glaciers is largely due to snow fall rather than temps
Good points all. The public is always the last to know. But if we’ve been looking around enough and are able to expose the hypocrisy of and just plain stupid nature of this “science” we are fed for mass consumption it is revealed to be just another series of parlour tricks for our entertainment. What is actually happening with our sun and EM energy here on Earth is the issue we are in need of facing openly and soberly. I am really not the person to have to write expertly about this. Agree decking the ridiculous Climate Change agenda is necessary - even if it means telling the whole truth.