Arctic Sea Ice (part 1)
A bracing analysis of the poster child of globalist alarmism: what you always wanted to know about Arctic sea ice but were afraid to ask
In my festive taster entitled Arctic Roll I gently introduced readers to a smattering of issues concerning Arctic sea ice: stuff we should all ideally know about but don’t. Knowledge is power they say, so let’s go get muscle-bound and snarling by indulging in a few colourful slides and statistical analyses…
We can start by wheeling out the favourite slide of alarmism, this being annual mean Arctic sea ice extent since 1978. This data can be found within the Sea Ice Index (SII) of NSIDC, the National Snow and Ice Data Center being a part of CIRES (Cooperative Institute for Research in Environmental Sciences) at the University of Colorado, and also being the oldest and largest of NOAA's cooperative institutes. We are talking deep respect!
Why 1978 and not 1928? Well, that’s when instrumented satellite data became available for the first time, the first ever data record being time stamped 26th October 1978. In a nutshell, a satellite platform in low Earth orbit is bouncing microwaves off the surface of the planet and fancy software is attempting edge detection at the boundary of open water and sea ice by analysing the reflected interference pattern.
Wot Ice Is That, Then?
Remote sensing of Arctic sea ice is a tremendously tricky business and once upon a time NSIDC confessed to edge detection errors of tens and even hundreds of kilometres right up front on their landing page. These days such information is buried down in a FAQ section which may be found here. To save gentle readers the bother, here’s the nitty gritty:
Passive microwave data may show ice where none actually exists due to signal variation between land and water along coastlines, or because of atmospheric interference from rain or high winds over the ice-free ocean.
Reasons that passive microwave data may not detect ice include the presence of thin, newly formed ice; the shift in albedo of actively melting ice; and atmospheric interference. Thin, newly formed ice is consistently underestimated by these data. Centers such as the U.S. National Ice Center and the Canadian Ice Service that publish sea ice data for navigation employ higher spatial resolution data that is better able to detect such thin ice.
Despite the limitations in passive microwave data, they still yield good large-scale estimates for the overall extent pattern and values of the ice. Plus, the limitations are consistent, affecting the data this year in the same way they have affected it in previous years. So when comparing from year to year, these types of errors do not affect the comparison.
While passive microwave data products may not show as much detail or be as accurate “on the ground” as other satellite data, they provide a consistent time series to track sea ice extent going back to 1979. Higher resolution sensors only go back to 2002.
Another reason for apparent errors in ice extent is that the data are averaged over an area of 25 kilometers by 25 kilometers (16 by 16 miles). This means that the ice edge could be off by as much as 25 to 50 kilometers (16 to 31 miles) in passive-microwave data, compared to higher-resolution satellite systems. In addition, we define ice extent as any 25 by 25 kilometer grid cell with with an average of at least 15 percent ice. Ice-free areas may nevertheless exist within an area that is defined by our algorithms as ice covered.
We estimate error based on accepted knowledge of the sensor capabilities and analysis of the amount of “noise,” or daily variations not explained by changes in weather variables. For average relative error, or error relative to other years, the error is approximately 20,000 to 30,000 square kilometers (7,700 to 11,600 square miles), a small fraction of the total existing sea ice. For average absolute error, or the amount of ice that the sensor measures compared to actual ice on the ground, the error is approximately 50 thousand to 1 million square kilometers (19,300 to 386,100 square miles), varying over the year. During summer melt and freeze-up in the fall, the extent may be underestimated by 1 million square miles; during mid and late winter before melt starts, the error will be on the low end of the estimates. It is important to note that while the magnitude of the error varies through the year, it is consistent year to year. This gives scientists high confidence in interannual trends at a given time of year.
So there we have it, straight from the horse’s mouth!
The errors involved are huge but consistent, and satellites using passive microwave alone are likely to miss vast areas of newly formed ice each year. We thus have to contemplate a crazy potential scenario in which sea ice in the Arctic has actually been growing at a time when microwave-based satellite data suggests it has been shrinking. Doh… I need a fresh pot of tea and a doughnut!
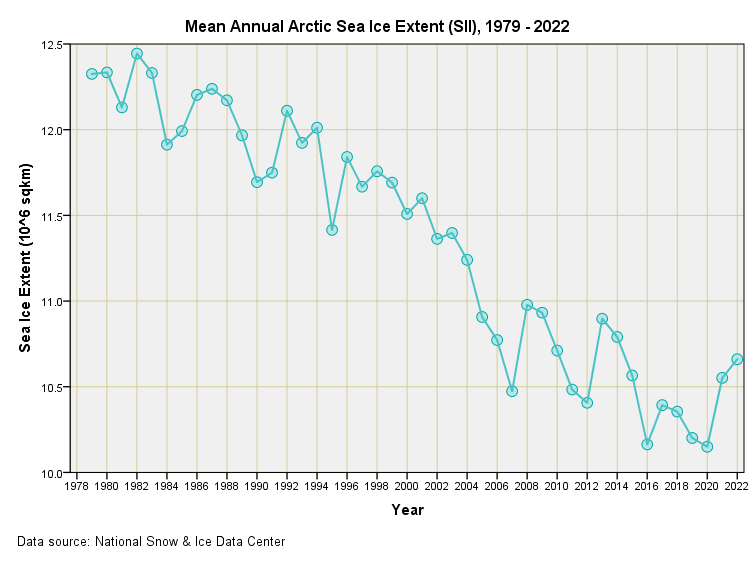
So let’s look at that classic alarmist slide of microwave-derived mean annual Arctic sea ice extent I promised before we got caught up in technicalities:
I’ve adjusted the scaling of the y-axis to generate as much ice melt doom as possible (though we really need to have a sober conversation about whether melting sea ice spells ‘doom’ for anybody or anything, including polar bears who have managed to survive loss of ice before now).
Down, down, down is the story and we can see that the mean annual sea ice level has dropped from 12.44 million square kilometres back in 1982 to just 10.15 million square kilometres in 2020, this representing a loss of 2.29 million square kilometres in 38 years, with a back-of-envelope coming out at a loss of 0.06 million square kilometres per year. If I run linear regression over this data this rate refines to a loss of 0.053 million square kilometres per year (R-square = 0.902; p<0.001).
When Will All The Ice Disappear?
Given our best estimate of a (linear) loss rate of 0.053 million square kilometres per year and a low point of 10.15 million square kilometres in 2020 then we can stab at our trusty hand-held calculators to reveal zero mean annual ice 191.5 years from then, bringing us to the zero point in the year 2212. That seems like a dreary-long time for keen alarmists so let me try and pimp that prediction by a combo of cherry picking and naughty modelling.
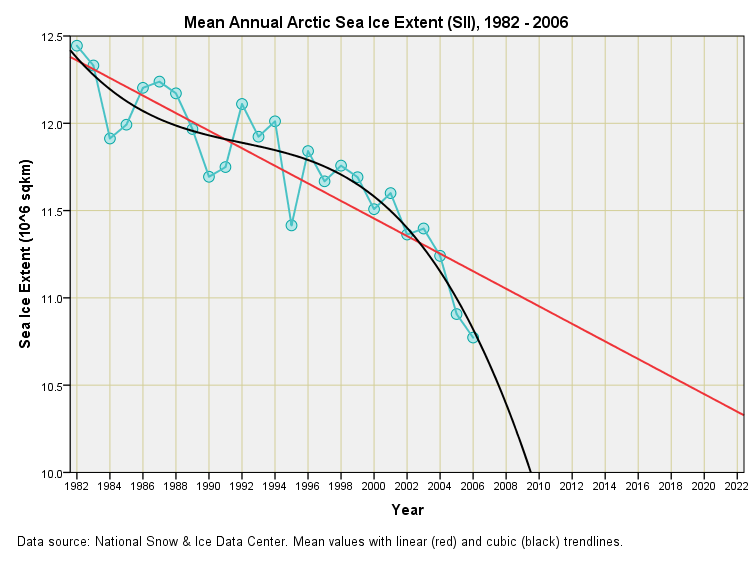
I shall start by considering the fat cherry period of 1982 - 2006 and fitting the bendiest mathematical model that I can get away with along with a bog standard linear regression… herewith the result in both tabular and graphical form:
The bog standard linear trendline has been crayoned in red, and yields a decent fit to the data (r-square = 0.780), with an estimated linear melt rate of -0.0503 million square kilometres per year. If we grab our trusty hand-held calculators we can predict zero ice for the year 2229. This is far too slow to be scary, so let us flip to using the cubic model that has been crayoned in black.
This is where I can pull the numerical wool right over people’s eyes by stating that the very best fitting model to the data is, in fact, the cubic model with an r-square up at a scorching r² = 0.860. No contest! The cubic model fit to the data wins the day and if we are being statistically rigorous about it this is the model we must chose. In doing so we bring the zero ice year forward to 2090. Now that’s more like it!
What puzzles me is that I have bent over backward to obtain the fastest possible melt scenario yet I’m still seeing some Arctic sea ice floating around in 2030 and even 2050. This being the case we need to ask what tea experts like Professor Peter Wadhams are drinking in order to declare total loss of summer sea ice several years ago.
The clue here is the word ‘summer’. Alarmists clamouring for the ice apocalypse tend to overlook the fact that these dire predictions only applied to the summer months when Arctic sea ice pretty much melts away to near zero every year - something we shall look at in the next article.
Whatever the situation may be total loss of Arctic sea ice cannot possibly cause global flooding as many of the public seem to think. You can test this for yourself by allowing a rather full G&T with plenty of ice to sit melting by your fireside. Significant sea ice loss does far more interesting things like altering salinity and sea surface temperature, with the greatest impact being pushed onto fauna and flora across the Arctic tundra (all of which has survived loss of Arctic ice many times before).
Assumption, Assumption, Assumption!
All this worrisome stuff assumes that ice loss will continue down, down, down at the same rate, yet we forget that the planet has been here several times before and done very well without carbon credits.
Total ice loss is not a good prediction to place your betting money on because if we focus on the period 2016 – 2022 we observe what may be the beginnings of an upswing in Arctic sea ice extent. If this is indicative of a cooling planet then we are heading for far bigger trouble than a pithering IPCC global anomaly of +1.5°C! Anyone who thinks otherwise may like to try growing carrots on a glacier.
Has The Decline Halted?
Possibly. Nobody knows but we can always wave our hands in the air and claim all manner, according to our belief systems and/or grant awards.
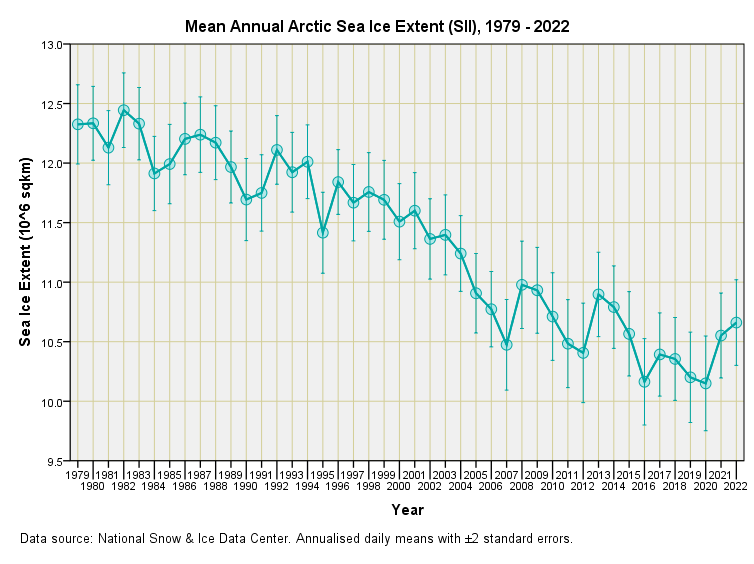
Up to now all we’ve done is consider the time series for annual mean ice extent whilst ignoring seasonal variation. This is a topic I’ll be covering in a future article but for now I’ll reproduce the same slide of annual mean blobs but with error bars representing two standard errors to give us some idea of inherent variation within the signal:
We now see that things are a bit hairier than those rather smooth alarmist-flavoured slides suggest.
If we take the big bottom year of 2020 we can see that the error bars for this year embrace mean values all the way back to 2007, and overlap with error bars all the way back to 2006. It’s not until we get to 2005 that we can say for certain that 2020 was deffo more ice free across the year as a whole. This is the thing with Arctic sea ice – assessment of ice extent is far more uncertain than folk realize owing to methodological issues with measurement reliant on passive microwave that are compounded with sizeable seasonal variation and, as we shall see, not all of the Arctic sea ice is melting at the same rate: some regions are not playing the game!
Another Cuppa?
To finish this article I’m going to do something very cheeky and that is to cherry pick like crazy. I’m going to split the time series into the periods 1979 – 2005, 2006 – 2015 and 2016 – 2022 and see what linear regression brings. Try this table for size:
This split file analysis reveals a statistically significant waning rate for the period 1979 – 2006 estimated at -0.046 million square kilometres per year (p<0.001), an insignificant waning rate for the period 2007 – 2015 estimated at -0.010 million square kilometres per year (p=0.760), and an insignificant waxing rate for the period 2016 – 2022 estimated at +0.057 million square kilometres per year (p=0.134).
We may conclude that we cannot be certain what Arctic sea ice is now doing, there being evidence of a slowing of the melt rate, with possible early evidence of an uptick in ice extent. One thing we can be certain of at this point is that any alarmist claiming certainty is wallowing in belief rather than data!
Kettle On!


No there were definitely comments on this part 1. I posted a link to Ron Clutz's website Science Matters -
https://rclutz.com/author/ronaldrc/
Where he often has much Arctic Sea Ice stuff.
Is it only me, or have comments gone missing on this post.