
Antarctic Sea Ice Index (part 5)
I continue to explore the relationship between sea ice extent, land surface temperature, sea surface temperature, lower troposphere anomalies & atmospheric CO2

In part 4 of this series we unearthed a strange situation in which sea surface temperatures derived by the big three – Hadley Centre/NOAA/ICOADS – appeared to have a negative relationship with atmospheric CO2 whereas the UAH NSST v6.0 crew told a different story of indifference down at the South Pole. I ended that article by stating that I better trust the NSST satellite data if I am to produce a sensible sea ice model, but it was too late… my curiosity had piqued!
This morning, as I sit surrounded by 16.5°C of sweltering August heat, a damp garden and the usual sheep-storm of journalistic drivel, I fancy taking another look at sea surface temperature as declared by the big three and comparing this series with the NSST values. Those coming late to the party had better start with this article first.
Diving straight in with a Pearson bivariate correlation between the merged series I am calling Sea Surface Temperature (Big3) and South Pole Lower Troposphere Ocean for the period 1979 – 2022 we find a measly r = 0.161 (p=0.297); that is to say there ain’t any correlation when there should be! This is rather unexpected so I got out my box of crayons:
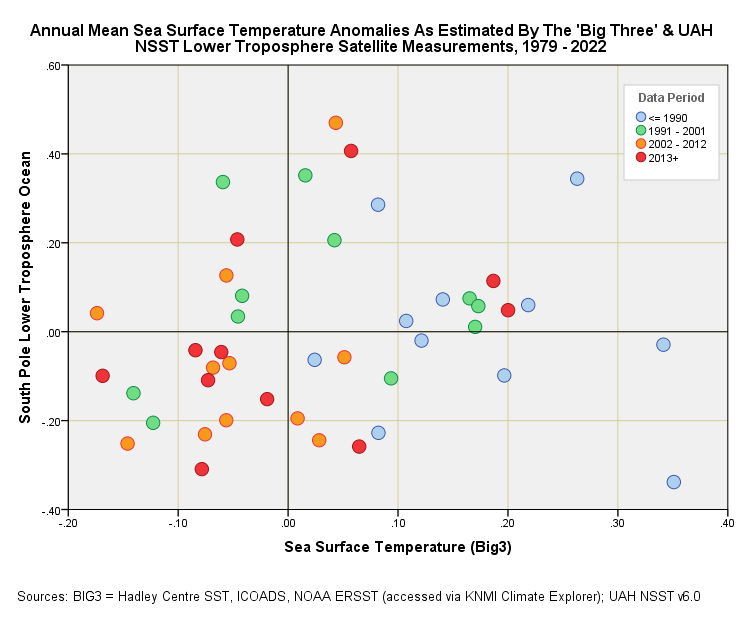
Now that is what I call a stumper! We’re looking at a random scatter, and even within the four 11-year sample periods that I threw in to spice things up. Why is it that mean annual sea surface temperature anomalies within the Antarctic region, as estimated by three leading organisations over the period 1979 - 2022, fail to correlate with lower troposphere estimates from the very best satellite instrumentation?
Why indeed?! My first thoughts are that what is happening in the surface layers of ocean is happening independently of what temperature the atmosphere above is reaching. A sensible stab, perhaps, but one that will get alarmists frothing at the mouth for I’ve just annihilated the core concept of global warming. Second thoughts are that the surface layers of Antarctic seas are being driven by another heat source that has nothing to do with next door’s SUV – volcanic activity and hot vents splattered across the sea bed, for instance. Then there’s the complexity of oceanic circulation, with warmer waters drifting in from elsewhere. Whatever the mechanism what we may conclude at this stage (assuming nobody is fudging the data) is that the polar atmosphere is decoupled from the sea surface in terms of heat exchange.
Oscillations & Heat Exchange
I haven’t, as yet, got any data on volcanic activity for the polar sea floor (I’m not sure anybody has) but I can get my hands on atmospheric oscillation data via the rather wonderful KNMI Climate Explorer. Whilst my morning hot lemon tea cools I shall rummage through the following series, starting with the most relevant in terms of heat exchange: Antarctic Oscillation Index (AAO), Southern Annular Mode Index (SAM), Pacific Decadal Oscillation (PDO) & Atlantic Multidecadal Oscillation (AMO). A quick correlation matrix covering the period 1979 – 2022 should do the trick:
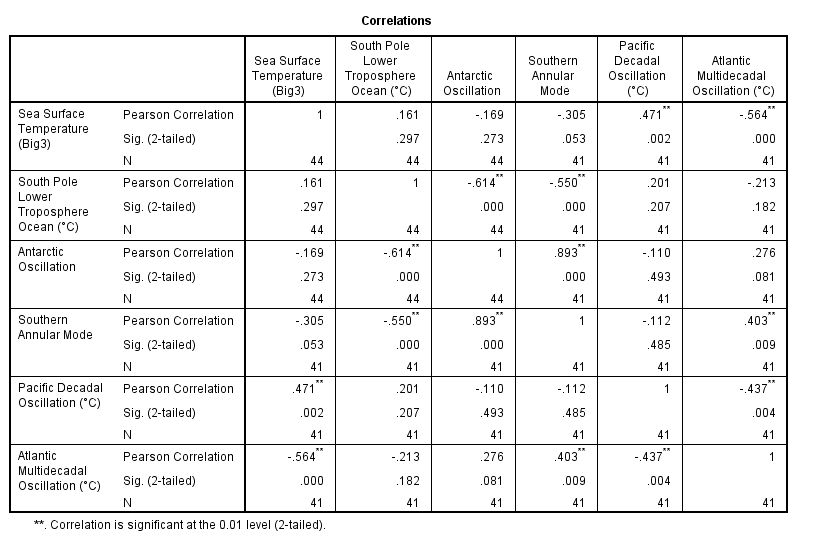
Now this is very tasty indeed! If we scan down the column for Sea Surface Temperature (Big3) we find a statistically significant positive correlation with the PDO (r = 0.438, p=0.004) and a statistically significant negative correlation with the AMO (r = -0.400, p=0.007). Thus, as the PDO index rises, so does the AAO index, which makes sense. The curveball comes from the AMO, for a falling Atlantic index is associated with a rising AAO. Curveball or not, both the AMO and PDO might therefore be useful when it comes to predicting sea ice extent.
What is also catching my eye is lack of a positive correlation between the big three SST data series and the Antarctic Oscillation (r = -0.169, p=0.273). This suggests the low-frequency mode of atmospheric variability of the southern hemisphere (strong westerly winds or low pressure surrounding Antarctica which moves north or south) is not coupled with sea surface temperature. I guess this makes sense.
Smashing Satellites
This leaves us with the NSST v6.0 lower troposphere Antarctic ocean satellite data to consider, and if we look down the second column we see zero correlation with Pacific and Atlantic oscillations and statistically significant negative correlations with both the AAO (r = -0.614, p<0.001) and SAM (r = -0.611, p<0.001). We ought to note once more the total lack of correlation with the Big three sea surface temperature data (r = 0.161, p=0.297). Ouch!
The biggest and best correlation with NSST data is with the Antarctic Oscillation and this is surely worth a scatterplot:
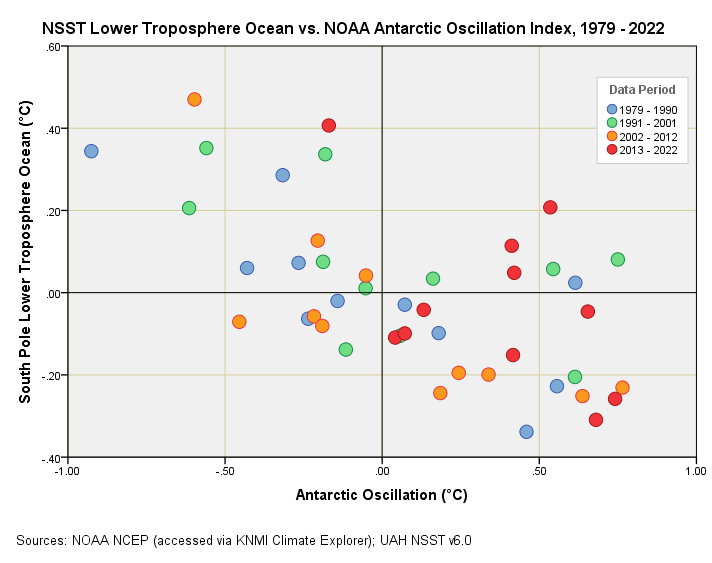
Fabulous indeed! There is no doubting the powerful negative relationship (I also took the trouble of downloading NOAA’s AAO series again just to be sure). The red blobs of recent years sit to the right, which is indicative of a positive-going AAO associated with a cool lower troposphere.
If we consider the 11-year periods then we observe the same negative relationship within each of these, though not all reach statistical significance owing to loss of statistical power – here’s the Pearson bivariate gubbins for geeks: 1979-1990 (r = -0.778, p=0.005); 1991-2001 (r = -0.549, p=0.081); 2002-2012 (r = -0.770, p=0.006); 2013-2022 (r = -0.513, p=0.107). Thus, we are not looking at some artefact arising from Simpson’s Paradox but a bone fide inverse relationship that could be darn handy when it comes to predicting sea ice extent!
Enough Excitement For One Day
I reckon that’s enough excitement for one day. What we have bubbling up are a few contenders for my sea ice model, and this gets me rubbing my hands and saying splendid one too many times!
Kettle On!
Somehow it is always the same - whatever 'they' say the opposite is usally revealed as the truth. Once upon a time I would dismiss 'conspiracy theories' now, often, my first thought is 'it could well be true'.
I am not sure if this might help on Antarctic volcanism:
https://agupubs.onlinelibrary.wiley.com/doi/10.1029/2021JD035095
Last night at about 3:04 a.m. the BBC world service said that July was the hottest EVER. At about 3:08 a.m. they announced that July was the hottest on record. Which record? 1944-2023? Also a news paper report said Dallas Texas record heat wave, every day since the end on June (until date of paper about 7 Aug) was over 100degF. About 34-36 days. I lived in that area for many years. Summer 1982 had 100 days over 100 deg F and 40 consecutive days