The Temperature Of The UK Over The Last 100 Years (part 3)
A butcher's at daily maxima and minima over the last 100 years. Are things getting worse, and what does ‘worse’ mean?
In part 2 of this series we took a closer look at the maximum daily temperature record at two UK airfields - whopping great Heathrow Airport down South and weeny little Wick Airport up North. Hardened activists are going to roll their eyeballs and declare a pathetic attempt to undermine a vast body of settled science, which tells us that they don’t understand anything about science.
Given that both airports are on the face of the globe, and given that both airports must obey the laws of physics (and especially the laws of thermodynamics), then we can use them as experimental subjects - guinea pigs if you will - to assess what is being billed as a global phenomenon. Global Warming is either global or somebody has sold us a lemon.
Yes, we are going to find localised factors, and yes the UK is going to behave differently to the Steppes of Russia, but global warming must leave its tell-tail trace everywhere otherwise activists will have to qualify their slogans: “global warming will fry us all… apart from those living in Croydon, maybe”.
Just two airports can tell us a great deal if we are genuinely interested in climate science. In this regard Heathrow and Wick have revealed they have both been warming since 1965, with Heathrow warming faster than Wick. This led us to our first estimate of the urban heat island effect (UHIE) which popped out at 1.8°C per century, this being some 0.3°C greater than the 1.5°C offered by the IPCC in SR15. Both airports also revealed to us lengthy periods where warming of the maximum temperature record hadn’t taken place when the science says it should have, with the mean daily maximum at Wick not shifting for 70 years. Since Wick Airport isn’t a mirage something must be happening there other than activism would have us believe.
With its lengthy data record stretching back to 1914 we also stumbled upon an incredible 1.0°C rise in the mean daily maximum record at Wick that took place over a span of just 2 years, those 2 years coinciding with preparations for WWII. Wick Airport is located in a remote region right at the tip of Scotland, so this finding tells us that UHIE applies even to rural airfields with just a smattering of tarmac and a few buildings. Consequently, and as science-types who are supposed to conduct research instead of regurgitate mantras, we may rightly ask just how much of the land surface temperature record for the rest of the globe is also due to UHIE. Have we stuck our thermometers in sensible places?
Plat Du Jour
Today Heathrow and Wick are going to be joined by 32 other UK weather stations. This will be made possible by converting their mean daily maximum temperature records into mean anomalies (have a look at this newsletter if the concept of the temperature anomaly remains a mystery). But before I assemble the sample let us have quick look at how the mean daily maximum temperature record for Heathrow and Wick stacks up against their respective anomalies.
Return To Planet Of The Airports
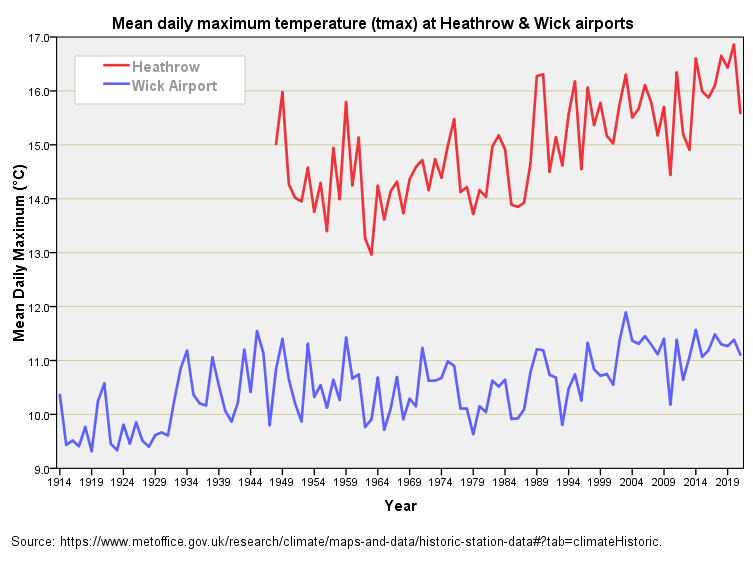
We shall refresh our minds with a time series plot for the mean daily maximum temperature (tmax) recorded at Heathrow and Wick airports:
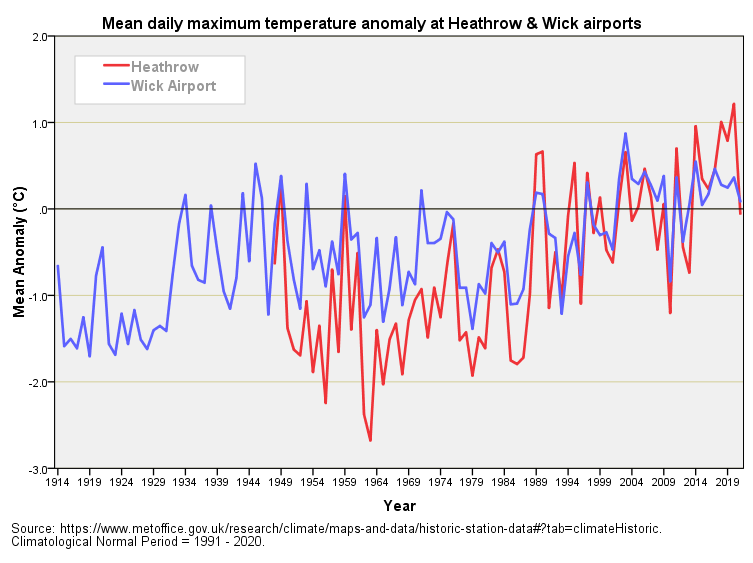
There’s cool-running Wick kicking off in 1914 and there’s warm-running Heathrow kicking off in 1948. All the features we discussed in the previous newsletter are there but they’ve been crushed by the scaling of the y-axis (vertical). My climatological normal is set at the 30-year period 1991-2020 for reasons mentioned in this newsletter, and here is the above data normalised to maxima recorded during this period:
If you mark out the period 1991-2020 with a pencil and ruler you’ll see both series hug the zero value on the y-axis, this falling out of our definition. Think of this as pinning two tails on the donkey by holding the root of the tail. Both roots will coincide on the donkey’s backside but the floppy bits are free to flop as they choose!
So what can we glean from this? Well, what has caught my eye is the red bit sticking up from 2014 onward. Despite both Heathrow and Wick being normalised to the period 1991-2020 this means that Heathrow has been getting hotter than Wick in recent years, ergo this cannot be a global phenomenon.
An Illusion Illuminated
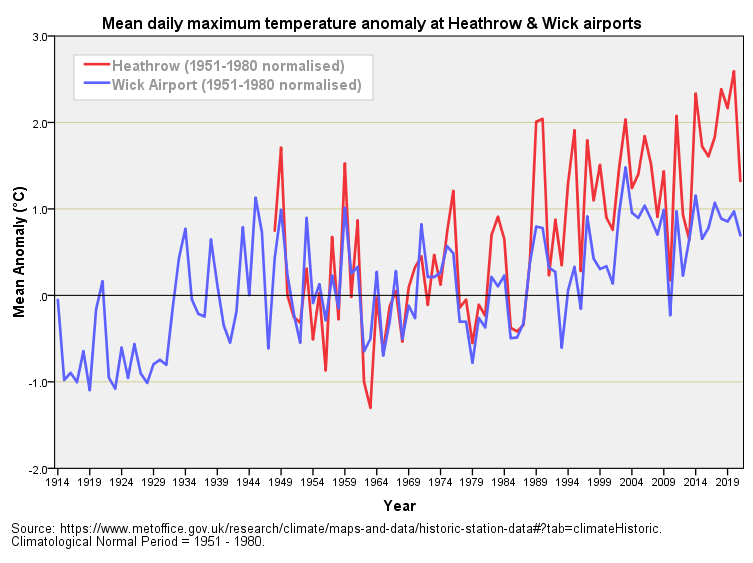
We might jump to the conclusion that Heathrow was running cooler than Wick back in 1954-1974 but this is an illusion of normalisation. Please bear this in mind whenever you encounter temperature anomalies produced by big players such as NOAA, NASA, Berkeley, Hadley Centre/CRU. What is happening here is that we’ve got hold of the donkey’s tail by the root and Heathrow’s fluffy end is flopping down more because of the greater rate of warming. To illustrate this illusion let me now shift my climatological normal period to 1951-1980 and re-work the slide:
Voilà! You now see both series running closely together around the zero value over the period 1951-1980 because this is how we’ve now defined things, the grand 30-year mean at each station for that period being subtracted from observed values to produce the zero anomaly series for each station. Another way of looking at this is to say that’s the period when everything was ‘normal’.
By grabbing hold of the fluffy end of the donkey’s tail we’ve ensured these stay together but the roots are now in very different places on the donkey’s backside. Heathrow now surges ahead, displaying an anomaly of +2.5°C whereas Wick is trundling along displaying an anomaly of +0.9°C.
This yields two possibilities: either Wick is ignoring activism and running cooler than global warming would dictate for some reason (i.e. global warming isn’t global), or Wick is indeed paying attention to activism and running exactly how global warming would dictate, from which we may deduce Heathrow is hotter than it should be because it’s in the middle of a dense urban sprawl that not only retains heat but produces it.
Activists prefer the latter but tend to omit the cause of excessive warming, pinning everything not on the donkey’s backside but fossil fuels, which enables them to thrill to the recent Met office announcements of record-breaking 40°C heatwaves at Heathrow because it validates their religion. Don’t tell them 40°C heatwaves are possible on a cooling planet within dense urban areas otherwise they’ll blow a gasket!
As I sip my cuppa I realise that if we put our faith in Wick Airport then we’re looking at an anomaly difference due to UHIE of 1.6°C after a span of 70 years or so, which is not far off my estimate of UHIE warming at 1.8°C per century using a different approach. This is quite delicious.
Before I leave these two anomalies alone I shall just point out that the illusion was illumined by moving my climatological normal from 1991-2020 back to 1951-1980. In this regard please note that the WMO climatological normal is stuck at 1961-1990 which means climate scientists everywhere will be seeing temperature records from urban areas warming at greater rates than those from rural areas. How many of these have risked their grants and/or positions and/or careers and come clean about UHIE contamination of the global temperature record? I’m not sure I would if I had kids to support, a massive mortgage and a department of scientists to keep afloat like I once did.
Can you trust a scientist with a mortgage?
Just As It Was Getting Interesting
Just as things were getting interesting, and by interesting I mean deriving a grand UK mean anomaly for maximum temperature since 1853, I have gone and run out of newsletter space! I guess it’s time to get some toast under the grill and open a packet of Kellogg’s.
Kettle On!


JD. Love it. I'm sure we can get a handle on the "true" value of the UK UHI effect with this sort of comparison. Interesting history to Wick airport. It was apparently a grass airfield until WW2. Paving and buildings have moved in from that time. I noticed Tallbloke has a 2004 site map of the met station with a note it may have been moved around that time closer to taxi way and apron. Old site (square to left) still visible.
https://tallbloke.files.wordpress.com/2012/08/image-107.jpg
I agree, "climatologists" won't bite the hand feeding them, but Mototaka Nakamura's book (in Japanese) has a very brief interesting English read about 25% into Amazon free sample.
https://www.amazon.in/kikoukagakushanokokuhaku-chikyuuonndannkahamikennshounokasetsu-Japanese-Nakamura-Mototaka-ebook/dp/B07FKHF7T2
Can you trust a scientist with a mortgage? Brilliant. And the donkey really helped too. So glad I found you! Thank you for all your amazing and light hearted work!