
The Temperature Of The UK Over The Last 100 Years (part 2)
A butcher's at daily maxima and minima over the last 100 years. Are things getting worse, and what does ‘worse’ mean?

I am now looking at an Excel spreadsheet of all the data I could squeeze out of this handy Met Office online resource. If any paying subscriber would like a copy please do ask - I’d like to think I’m delivering decent value for money!
Introducing Tmax
Tmax is where we shall start, this being defined as:

Just to make sure everyone understands how Tmax comes about, the absolute maximum temperature at each station is noted on a daily basis and at the end of every month somebody calculates the arithmetical mean (a.k.a. average) of these readings. Tmax is thus not a data record of the hottest temperatures recorded at each station and, if I am being honest, these are rather silly things to announce to the general public unless you are dead keen on climate propaganda.
There are several reasons for this silliness starting with the analytical reality that extremes of any kind are regarded as outliers by statisticians who will throw them away and/or replace them with interpolated, modelled or smoothed estimates. Then there’s the technical reality of a new record being held for less than a minute (depending on the sampling resolution and automated quality control procedure). Then there’s the comic reality of somebody doing something unusual in the vicinity of the Stevenson screen, like parking an ice cream van. Then there’s the surreal reality of putting your thermometer somewhere truly stupid:
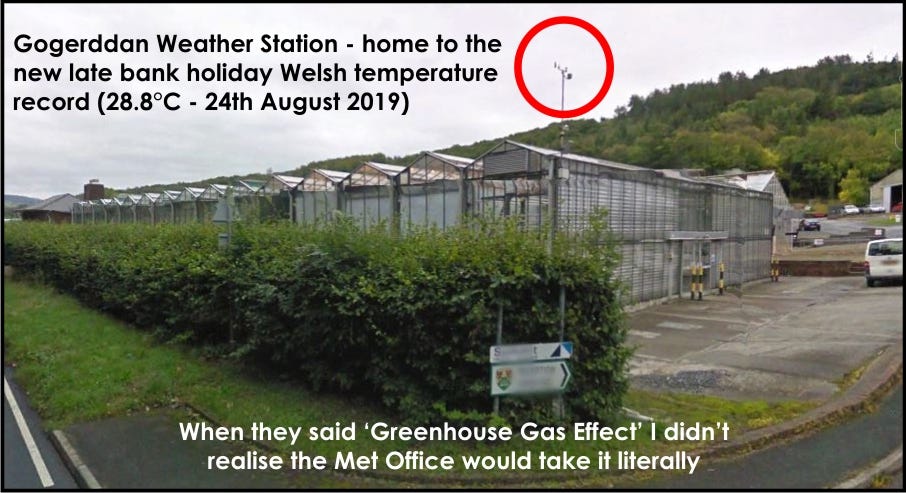
By taking the average of several measures of maximum daily temperature at a specific location we iron out the effects of outliers generated by ice cream vans, venting greenhouses and other such sources of localised heat so we may start to guess what the weather is actually doing. This approach will yield better stats but it doesn’t really cut the mustard when it comes to the business of producing scary news headlines.
One other thing to bear in mind is that we can continue to log record daily temperatures on a cooling planet. This will come about if climate variability is on the increase whilst temperatures are decreasing. Statisticians give this a fancy word that comes in handy at drinks parties, this word being heteroscedasticity. Check out this Wiki entry, then try slipping in something like, “apparently, it’s all down to heteroscedasticity and not our SUV, darling” over canapés.
In sum, the mean daily maximum temperature a.k.a Tmax is a jolly decent sort that paints a truer picture than the Met-bod on the TV with the scary red and black heat maps.
Hot & Cold Running Stations
What we can do now is select a period when all 37 stations in the Met Office sample were simultaneously collecting maximum daily temperature data so we may compare them. As stated in previous newsletters Cwmystwyth, Ringway and Southampton closed a while ago, so our 37 stations must become 34 (a.k.a. UK34). Camborne was the last to get going in Sep 1978 so our first complete year for the UK34 is 1979. If we now average the monthly series for mean daily maximum temperature over the period 1979 - 2021 we arrive at a single grand mean for each of the 34 stations under study. Here’s what that looks like in graphical form:
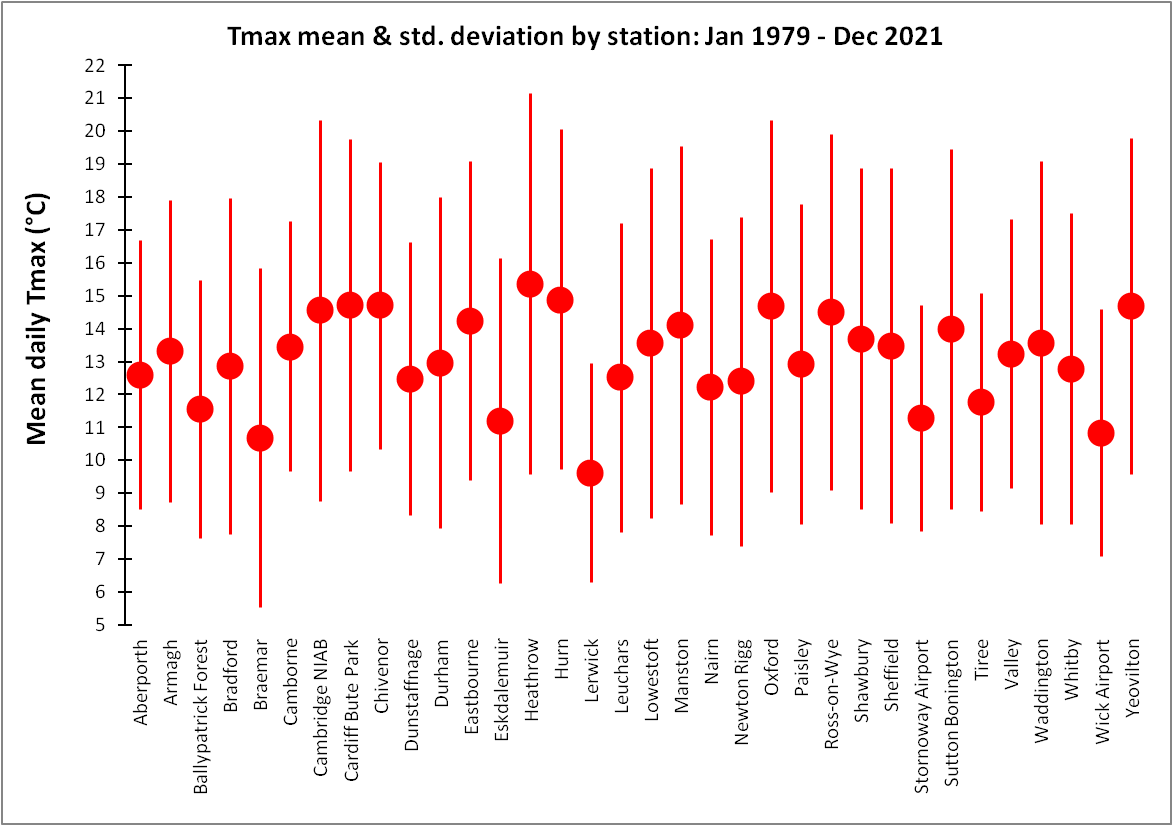
Scotland is cold (no surprises there) and Heathrow wins the prize for hottest running station (no surprises there, either). Before I turn the UK34 tmax data into a UK-wide anomaly I shall take super-hot Heathrow Airport and compare it with super-cool Wick Airport for curiosity’s sake.
Battle For The Planet Of The Airports
Heathrow first put its thermometer out in 1948 so our story must start there. What amuses me is when Met Office talking heads state that a new UK temperature record was set at Heathrow, this being “the hottest on records since records began”. There’s then usually a second sentence (separated from the first) stating that records began in 1853. Both of these statements are intrinsically true but a gullible public not familiar with journalistic trickery will leap to the erroneous assumption of a contiguous data series at Heathrow going back 170 years. In reality we have no idea of how hot Heathrow got during the heatwave of 1947!
So let’s have a look at tmax for Heathrow and Wick for the period 1948 - 2021:
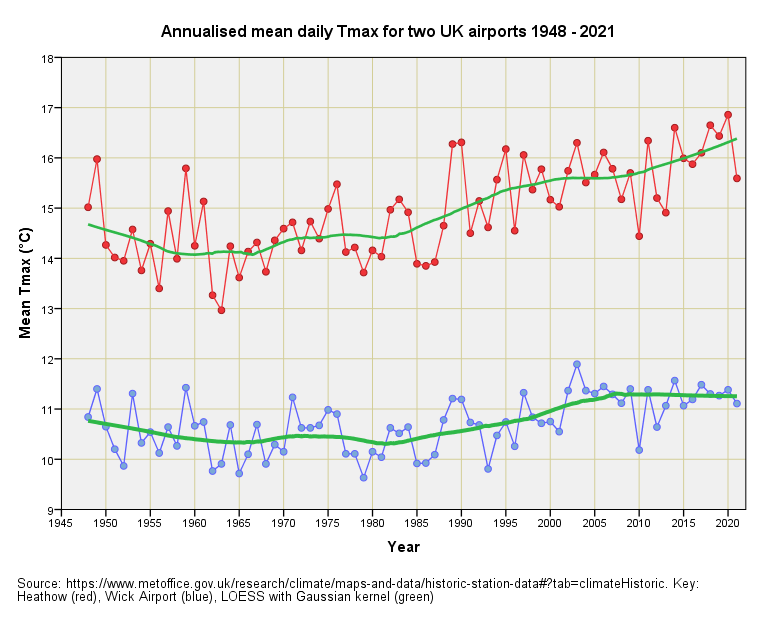
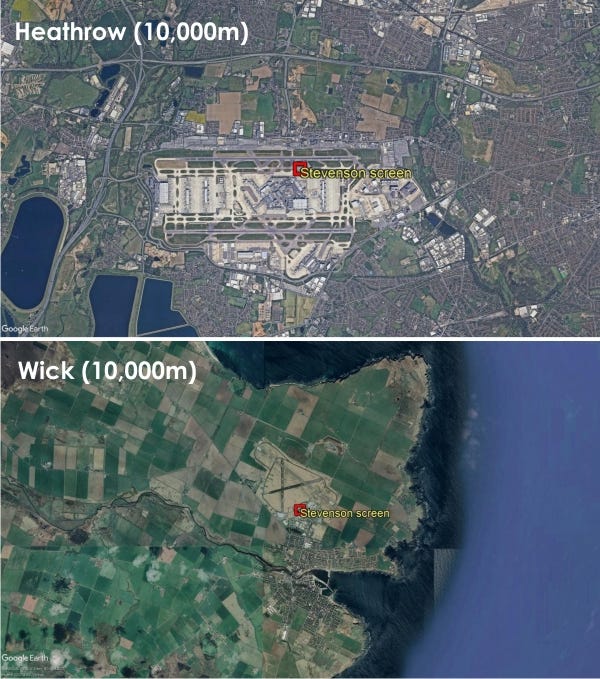
Those wiggly green lines are a favourite spanner of mine being Locally Estimated Scatterplot Smoothing (LOESS) functions, a.k.a. local regression. These tell us much more than one of those straight lines produced by Linear Regression but I shall use this spanner later. We can see that Heathrow runs hotter than Wick, which is no surprise when you learn where Wick Airport is located in relation to Heathrow…
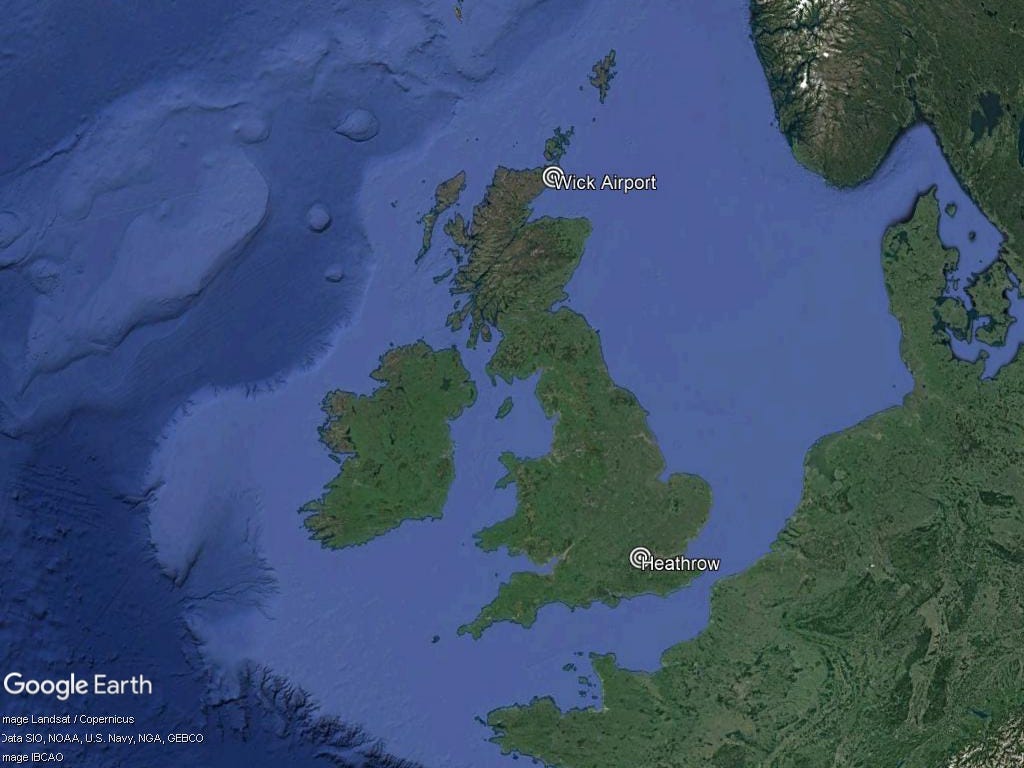
And when you compare the level of urban development…
What interests me more is that both locations show initial signs of cooling from 1948 to 1965 or thereabouts. How is this possible if fossil fuel emissions were rocketing during the post-war boom? The short answer is that there’s far more to the climate than activists would have you believe; the long answer is what I shall provide over a fair few newsletters.
The Small Spanner
This leaves us with a late upturn in warming from 1965 onward. Whilst this is evident at both airports, it is far more evident at Heathrow and this is likely due to urban development. What I’ll do now is reach for one of those linear regressions (a.k.a. the small spanner) and establish the warming trend for 1965 - 2021 for both airports. Herewith two servings of stats output:
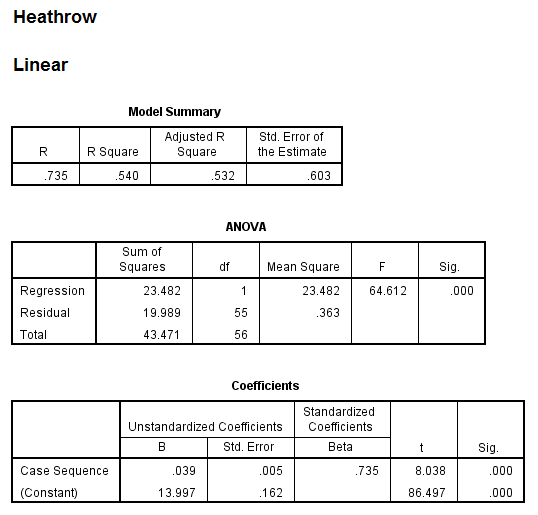

The nitty gritty here boils down to a linear warming trend estimated at 0.039°C per year for Heathrow (p<0.001) and 0.021°C for Wick (p<0.001), both being highly statistically significant. These are point estimates bound by error and so we can run an independent samples t-test to check if the two rates are significantly different given their associated standard errors. I am pleased to confirm what we’ve already guessed and that is the two warming rates are indeed significantly different (p=0.003, equal variances not assumed).
A First Glimpse Of UHIE
We may attribute this difference to the urban heat island effect (UHIE). All of our land-based weather stations are plagued by UHIE but you won’t find much mention of this in the literature or on the telly. The Met Office give a slight nod in the general direction of UHIE when the weather personage utters, “it will feel warmer for those living in cities” or, “it will feel colder for those living in rural areas”, or words to that effect. We thus find ourselves living in a parallel reality where UHIE is blamed on climate change rather than a concrete, steel, iron, brick, tarmac and localised heat-source jungle.
Turning back to our brace of coefficients we see that Heathrow is warming faster than Wick to the tune of 0.018°C per year or 1.8°C per century. What causes my eyebrows to twitch is that this is greater than the estimated global warming rate of 1.5°C offered by the Intergovernmental Panel on Climate Change (IPCC) when they issued Special Report SR15. This begs the question: are we being taken for an urban ride?
Looking Up And Looking Down
We can attempt to answer this question by looking up at satellite data gathered since 1979 (more on this in future newsletters) and by taking a closer look at the state of our land based weather stations (more on these in future newsletters). Whilst the oven is still warm we might as well take a look at what isolated Wick has been doing since it started collecting data in 1914:
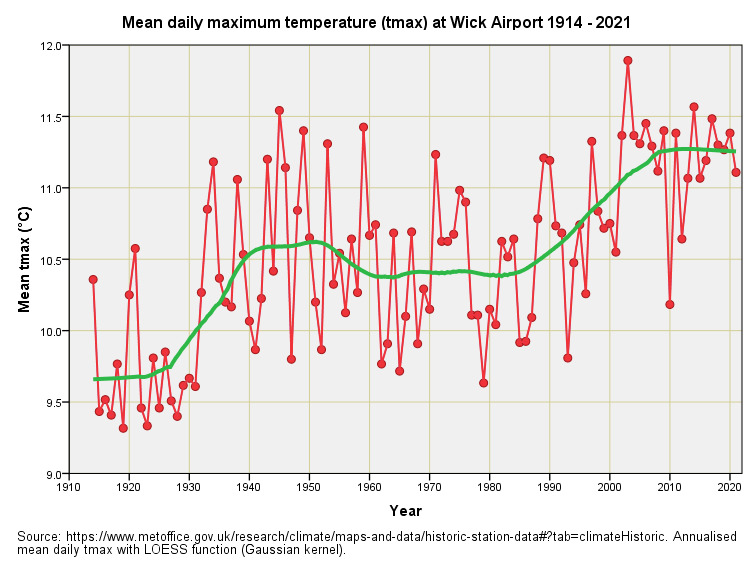
Did I hear a wergh or a woah, or perhaps a quiet WTF under the breath? I certainly spluttered my cuppa when I clocked the dramatic increase in temperature maxima after 1930. I think we can guess why. I’m going to put money on Wick starting out as a grass strip with a flagpole and wooden hut back in 1914 - 1929, thereafter becoming a tarmac and Nissan-hut laden airbase with plenty of corrugated iron roofing and concrete shelters. We might call this the Military Heat island Effect (MHIE), which looks as though it has been responsible for a ~1.0°C rise in maximum temperature within the space of 2 years. Now that is what I call warming!
How many more weather stations are hiding a similar skeleton in Stevenson’s closet? How substantial is UHIE in real life (as opposed to the virtual life of the UHIE modelling community). Now that we’ve seen just how much things can swing, how confident can we be that any Stevenson screen within earshot of any whiff of development is recording what the climate is actually doing rather than a sheet of corrugated iron or block of concrete?
So… how much of that rise that we observe since 1980 can be attributed to climate change and how much to continued development of Wick, along with increased passenger throughput and other activities? I’ll be attempting to answer this in a cross-sectional study I have planned for the UK34 stations.
A Cooling Climate?
Before we leave this slide alone it is worth noting the rather stable 70-year period at Wick Airport that spans 1933 - 2002 or thereabouts. Given airport use and development would have progressed during this era, then I must logically deduce that the climate probably cooled at this location. I’m not sure activists will like this finding very much, so we better check with a spot of linear regression:
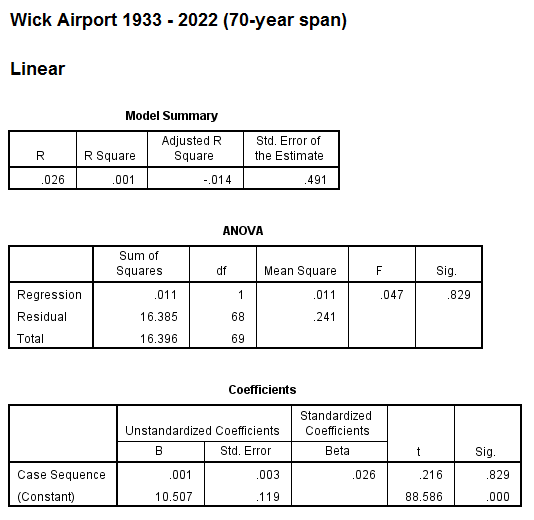
Well there you go - we have a warming rate of 0.001°C per year that is totally and utterly statistically insignificant (p=0.829). How is it possible that we are unable to detect warming within the maximum daily temperature record over a span of 70 years at this location? Get the biscuit tin open for part 3 is in preparation…
Kettle On!
I love your assumption that we out here will look at a graph and cough out our tea in shock. Truth is for me, who couldn't get a maths o'level in two tries, I'm waiting for your conclusions to enlighten me, while being highly entertained on the way there by your writing style.( I did get English so that's not beyond me luckily). But, perhaps somewhere in the weeds of my words is a point, that I for one need you, at times, to imagine you are talking to 10 yr olds, and so give me something very much on a plate, along with your biscuits!
Lovely as always! Those pesky averages.
How do you want us sharing this into socials, John? I love niggling climate alarmists with stuff like this, but these are locked yeah?