
How Many Named Storms Should We Expect?
The UK has been battered (and not so battered) by nine named storms within five months but is this über unusual?

The legacy media certainly seem to think so, with the following example being offered by Ian Jones of The Evening Standard and distributed through MSN:
Storm Isha marks only the second time in a UK storm season that the letter I has been reached in the alphabet.
Storm seasons run from the start of September to the end of the following August.
The first time the letter I was reached was in February 2016, with Storm Imogen.
The furthest a storm season has reached in the alphabet is the letter K, when Storm Kate was named in March 2016.
The Met Office began naming storms in 2015.
Last year’s storm season, which ran from September 2022 to August 2023, made it only as far as the letter B, with Storm Betty in August.
By contrast, this year’s season has seen storms named in every month so far: Agnes in September 2023; Babet in October; Ciaran and Debi in November; Elin, Fergus and Gerrit in December; and Henk and Isha in January 2024.
It is the only instance to date of named storms occurring in the first five months of a season.
The list of storm names is compiled jointly by the Met Office, Met Eireann in Ireland and KNMI, the Dutch national weather forecasting service.
It is assembled from suggestions submitted by the public and by staff within the three organisations, and is announced at the end of August just before the start of the new storm season.
Not all of the alphabet is used when naming storms.
The letters Q, U, X, Y and Z are omitted, in line with the convention established by the US National Hurricane Centre.
It means the storm names still available for the current season are Jocelyn, Kathleen, Lilian, Minnie, Nicholas, Olga, Piet, Regina, Stuart, Tamiko, Vincent and Walid.
Key points to take on board here are that the naming system only began 9 years ago, which is a ludicrously short time over which to determine trends, and that the 2015/16 season saw 11 named storms, with the 2022 season seeing just 4 storms. The current season has already witnessed 10 storms, presumably with a few more to follow in the remaining months. We need far more information than this to make a sensible assessment and so must look the gift horse in the mouth…
The Horse That Keeps Giving
The horse’s mouth, the Met Office’s UK Storm Centre online pages, may be found here and the first thing we should note is just how slippery the definition of a named storm is:
In the UK a storm will be named when it has the potential to cause disruption or damage which could result in an amber or red warning. This is based on our National Severe Weather Warnings service, which is a combination of both the impact the weather may have, and the likelihood of those impacts occurring.
Storms will usually be named on the basis of the impacts from strong winds, but the impacts of other weather types will also be considered. For example rain, if its impact could lead to flooding as advised by the Environment Agency, SEPA and Natural Resources Wales flood warnings, or snow. Therefore 'storm systems' could be named on the basis of impacts from the wind but also include the impacts of rain and snow.
Being an applied statistician and a former government scientist I like to run hard facts through my computer such as maximum mean daily wind speed and total daily rainfall in order to determine storm trends, as I have done in six articles since 1 November 2023, with four more to come. Whilst this will give you a less slippery summary of how things really are it will not offer insight into the new game being played by the Met Office, which hinges on a quasi-subjective assessment of potential to cause disruption or damage. Hence, this morning I shall dedicate this article to playing the new game, but viewing the moves through the eyes of a statisticalista. Get some coffee on, for you may need it!
I Nearly Spilled My Tea!
After scrolling down the UK Storm Centre page I came across a modest para that would have gotten me blurting my tea or dropping my biscuit were I had some to hand:
Here we have Met Heads effectively summarising what I’ve been ranting on about for months and months in just 35 words. Though, to be honest, I’ve managed to scoff far more biscuits in the length of time I’ve taken to come to the same conclusion which surely is a plus!
Then I got to thinking. The Met Heads clearly already know that the most obvious measure of storm ferocity – wind speed - isn’t supporting the alarmist narrative and the cheeky monkey in me wondered if this is why they’ve developed an alternative measure – the named storm - that possesses an element of subjectivity. What’s the betting that they decide on potential to cause disruption or damage using a computer model developed in conjunction with Imperial College?
Start With The Obvious
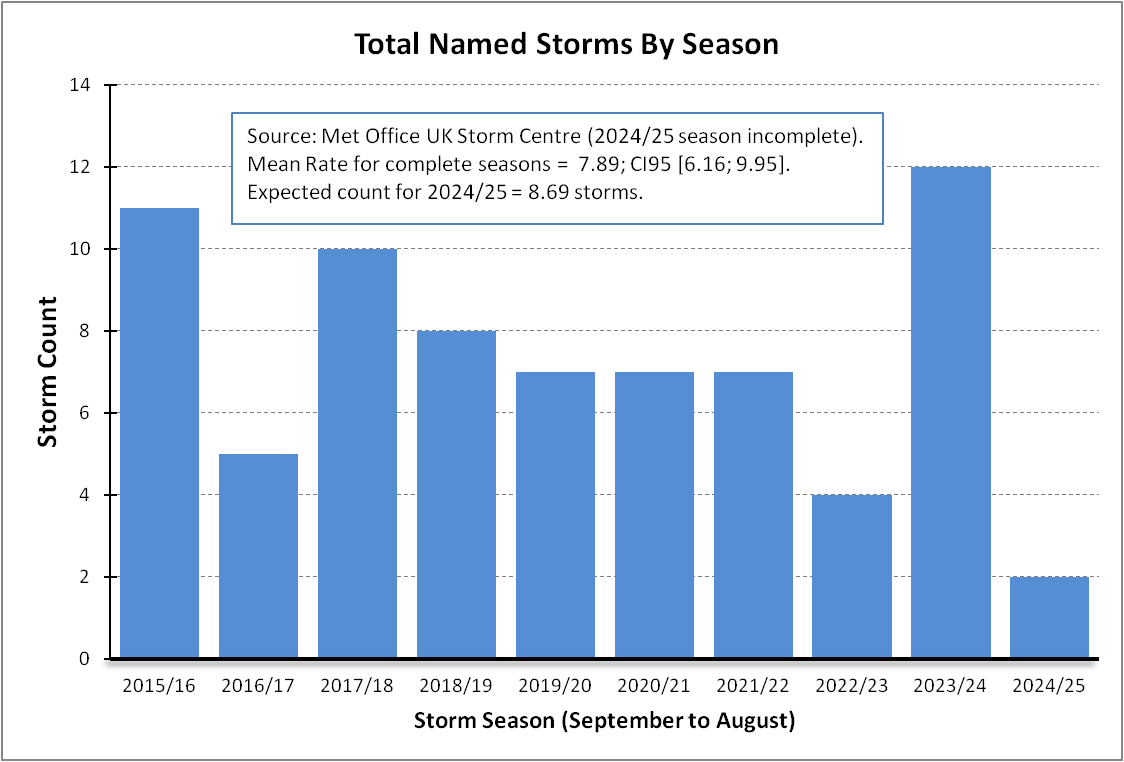
Bizarre as it may seem the obvious is missing from the UK Storm Centre main page – a summary of named storm counts by season. God may work in mysterious ways, but the Met Office is unfathomable! Herewith a summary table plus a slide for you all, and made with love even before I made my morning cuppa:
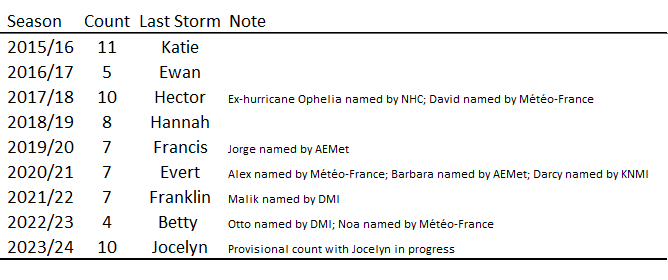
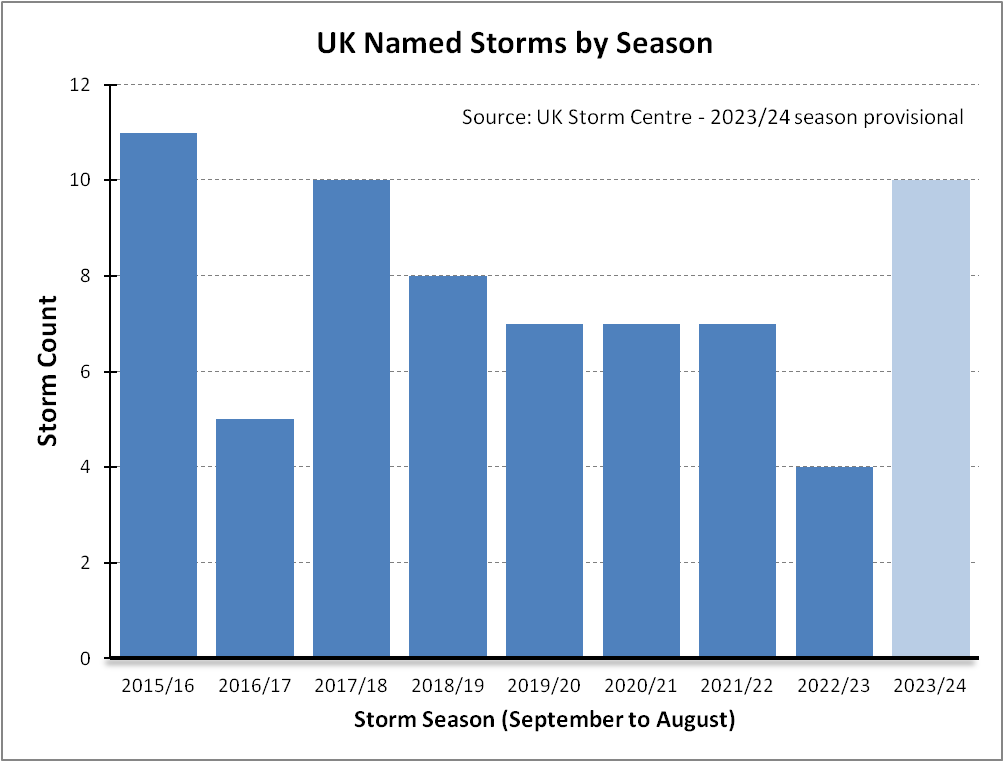
At the time of writing the 2023/24 count is provisional with storm Jocelyn underway and with 7 months to go before the clock stops ticking. If we place a sheet of paper over that final pale blue column what conclusion do our eyeballs come to without thinking that much? Exactly, our eyeballs are thinking that there is a general decline in named storm frequency.
A quick and dirty linear regression for seasons 2015 through 2022 reveals a negative slope that is statistically insignificant (p=0.105) but this sort of thing will earn me a slap on the wrist and what I should be running is a generalised linear model (GLM) using an appropriate error structure and identity link for these are count data and not normally-distributed continuous measures. Ye gods!
Fish Market
If the Poisson distribution is assumed for the GLM error structure; that is to say if we consider named storms to be discrete events occurring in a fixed interval of time whose occurrence is independent of each other, then the appropriate regression yields the following:
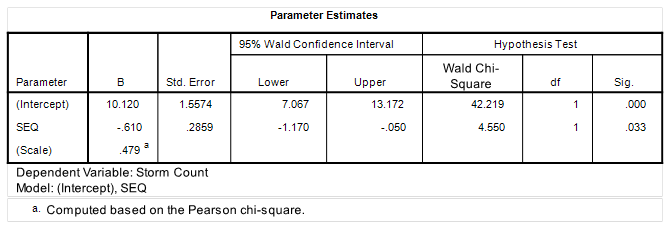
The sequential passage of seasons is represented by the independent variable ‘SEQ’ and we discover that this term now passes statistical significance at the 95% level of confidence in the prediction of the named storm count (p=0.033). What this boils down to is that something is likely going on to reduce the storm count rather than this decline being a chance effect. Whoops!
Named storms in a statistically significant decline, eh? I didn’t see that one coming! Neither have I seen any comment about this hard fact by the Met Office and the many environmental correspondents trying to convince us of a dire climate emergency. The current storm season sitting at 10 storms and counting must be a blessed relief to alarmists, but when we put this count into the pot then that fancy GLM thing yields total insignificance at p=0.494.
Some bright spark might ask how big the 2023/24 season count must be in order to secure a statistically significant positive trend within GLM. The answer is that the critical p=0.05 value is reached with a total of 60 named storms for 2023/24. Wow indeed. That’s a lot of storms and a very unlikely scenario, which means the 2023/24 season, even if a whopper at 15 - 20 storms, is going to result in an insignificant trend either way: in sum it will be business as usual.
This nothing burger with no relish and limp lettuce is why environmental correspondents have to try and come up with imaginative ways in which to crunch the figures to make things look worse than they are, and Ian Jones of The Evening Standard has done just this (and no doubt earned a tasty bonus).
Poisson Mean Rate
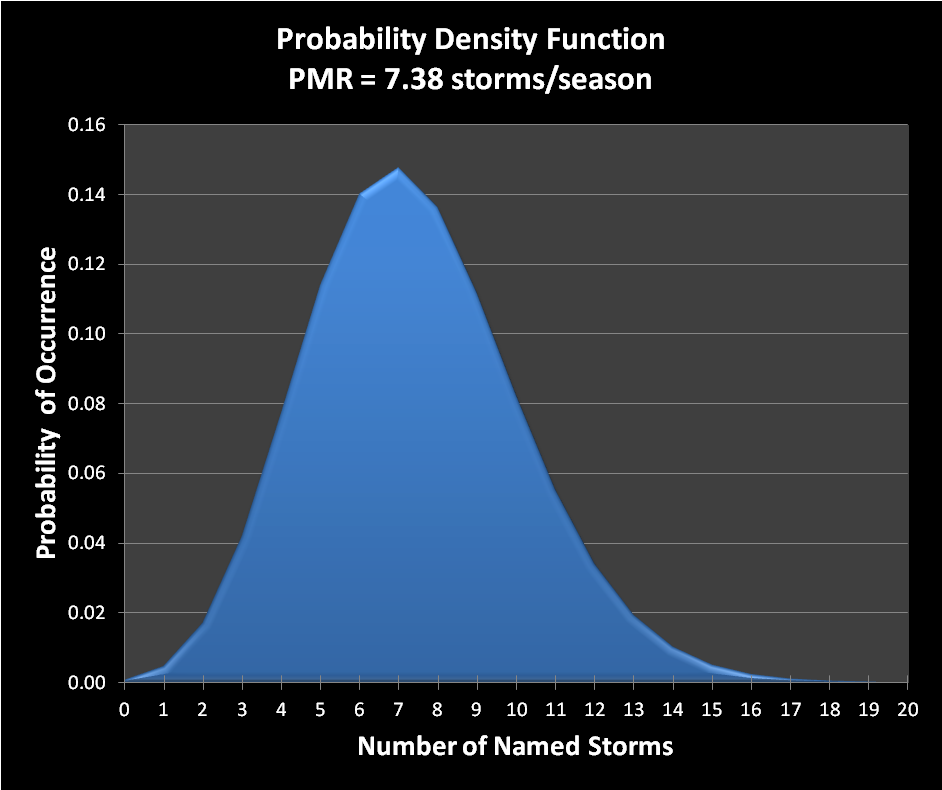
So far I have mentioned three essential qualities of the Poisson distribution but there is a fourth and that is an underlying fixed Poisson mean rate (PMR). We may think of this as the true rate of happenings that pop up as varying numbers of discrete events over fixed intervals of time. If we look at the table of counts for named storms for the complete seasons 2015/16 through to 2022/23 then we observe a total of 59 storms across 8 seasons making an historic grand average of 7.38 storms per season, this being an estimate of the Poisson mean rate (λ).
Like any other sample estimate in statistics this comes with a confidence interval expressing the envelope in which the true (population) mean rate probably lies. If we want to be 95% confident of the ‘true’ mean rate then a Poisson calculator yields a mean rate estimate of anywhere between 5.6 and 9.5 storms per season. If we want to be 99% confident then a Poisson calculator yields a rate estimate of anywhere between 5.1 and 10.2 storms. These are fairly wide intervals and offer a bittersweet lesson in the happenings of relatively rare events like named storms: pretty much anything goes!
As it stands the named storm total for this season sits at 10, which puts it into the realm of statistical significance at a shade under the 99% level of confidence. Nerd-geeks may want to consider the probability density function for a Poisson distribution whose mean rate is λ = 7.38; everyone else ought to look away now:
Indigestion
We have two divergent results on the table capable of causing indigestion! Linear regression (fancy or plain) indicates business as usual even with a final storm count of 15 – 20 for this season, whereas a consideration of the historic storm rate suggests we are already nudging 99% confidence (p<=0.01) at just 10 storms so far – what gives?
What gives is the assumption of a fixed Poisson mean rate may not hold. That is to say, whatever is generating the UK’s named storms may not be constant over time, so a simplistic approach to analysis may well be misleading. You can judge this for yourself by asking if we have seen 10 named storms before and the answer is yes indeed, we saw 10 storms back in 2017/18 and 11 storms back 2015/16. In conclusion we are not sailing into new and fearful territory and have been here before regardless of how the media are going to spin this thing.
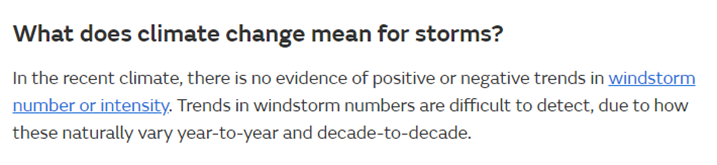
My personal preference is to consider what our eyeballs are telling us from a slide of raw counts and to lean toward generalised linear modelling with a Poisson error structure that indicates a statistically significant decline from 2015/16 to 2022/23, with a return to the usual business following the current season. Indeed so, for we must bear in mind that the Met Office themselves admit that a climate change signal cannot be detected for wind-driven storms, but I don’t think this will stop the alarmist press.
One More Thing…
Those who have followed my article series Putting The Wind Up… may well be curious as to how actual wind speed for UK & Irish waters measures up against the number of named storms. Like any sensible person we may expect there to be some sort of general correlation in that seasons with the greatest number of named storms might be expected to yield the highest seasonal mean wind speed. Except this isn’t the case!
I don’t want to go over the detail again but basically what I did was put a big grid down over the UK and Ireland to include the inshore waters where the wind really rips. The International Comprehensive Ocean-Atmosphere Database (ICOADS) was then interrogated to reveal monthly maximum mean wind speeds for the period 1800 – 2023. The same storm season of September – August was adopted and ICOADS season means bolted onto the named storm dataset.
With only eight complete and one partially complete record set in the pot, making nine records in total we have to acknowledge that the data are a bit thin on the ground but I was hoping for some sort of signal to shine through; except it didn’t. A Pearson bivariate correlation returned a troubling r = -0.032 (p=0.936, n=9), with the scatterplot looking like this:
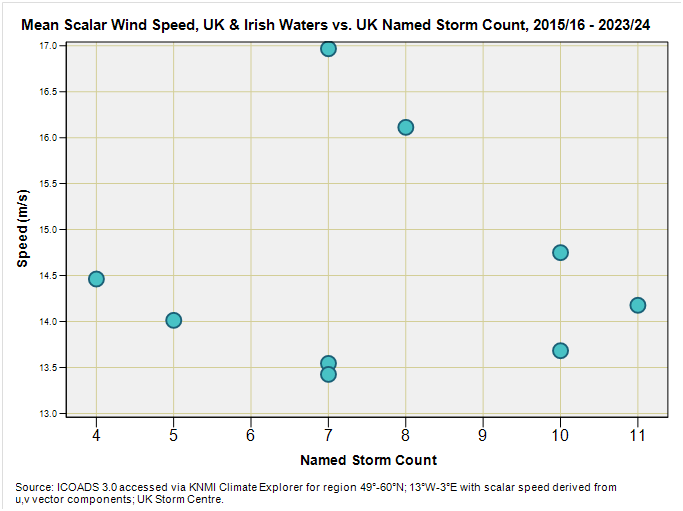
This is a nothing burger with no fries or mayo. There is not even a bun. We can have 11 named storms in a season with a seasonal mean scalar speed of 14.18m/s and we can have 4 named storms in a season with a seasonal mean scalar speed of 14.46m/s. When it comes to named storms it would appear that wind speed means nothing.
We should have guessed as much when the Met Office said “In the UK a storm will be named when it has the potential to cause disruption or damage”. Potential, huh? Not actual then, but potential. Potentially speaking I am a lottery winner.
If I can think of a better way to go about this I’ll roll my sleeves up once more. For the time being I fancy it’s time for some tea and hot buttered crumpets.
Kettle On!
Update 24 Nov 2024
We’re in the middle of storm Bert, which is bringing the usual rain and wind, with the usual debris and flooding here in the South West. This didn’t stop the Dee’s making it to Morrison’s for provisions, and I didn’t even need to wear my wellies! Whilst waiting for the kettle to boil I’ve updated the above slide with the 2023/24 complete season count and added where we are so far. The overall mean rate for all 9 seasons fetches up at 7.89 storms per season, the 95% confidence interval for which spans [6.16; 9.95]. With 2 storms notched up in 2.76 months to date we’re heading for an expected total of 8.69 storms this season, which is sitting well within the confidence limits.
Kettle On!
A few typos with figures have been corrected! Dangnabit!!!!!
It seems to me they have to name every puff of wind now. The hank one we never even had a puff! More limp halibut than leaping salmon nearly every time. Ok, last two were sure breezy but then more things were blown over a couple of nights later without the luxury of a name