
Putting The Wind Up… (part 1)
I take a quick look at historic wind speed for UK & Ireland plus their waters in order to gain some perspective on all this named storm malarkey.

These days it’s the thing to name drop. Not celebrity or very important persons names as such, but names of storms. This year so far we’ve had storms Agnes (27 – 28 Sep), Babet (18 – 21 Oct) and Ciarán (currently underway) with Debi waiting in the wings somewhere (or should that be ‘winds’?). The Met Office never used to bother to name storms, preferring to point at a weather map and say something about it being windy/stormy (be careful out there tonight sort of thing). All that changed in 2015 when named storms became a thing.
I recall a Met Head at the time rambling on about raising people’s awareness of the weather and how dangerous/destructive it can be. That goes without saying but in the back of my mind lies a conspiratorial worm that quietly suggests that the climatological powers that be are using every opportunity to frighten the public utterly shipless. The official ramble goes like this…
The naming of storms using a single authoritative system provides a consistent message and aids the communication of approaching severe weather through media partners and other government agencies. In this way the public will be better placed to keep themselves, their property and businesses safe.
That all sounds fab, above board, squeaky clean, wonderful and groovy but the cynical ex-government scientist in me asks why they couldn’t be bothered about public safety, their property and their businesses prior to 2015.
I guess all will depend on how they use the system because it could be a good thing, yet it could also slip into propaganda. I’m waiting for the MSM headline that will be something along the lines of ‘2023 has seen the most named storms since records began’, with the environmental correspondent responsible failing to mention that the system started in 2015. The public, being numerically lazy, won’t bother to think for themselves as usual and will simply swipe past the headline. Job done, Net Zero here we come!
So let’s go grab some data and use our brains again! That slogan ‘use it or lose it’ seems most apt.
What, Where, When?
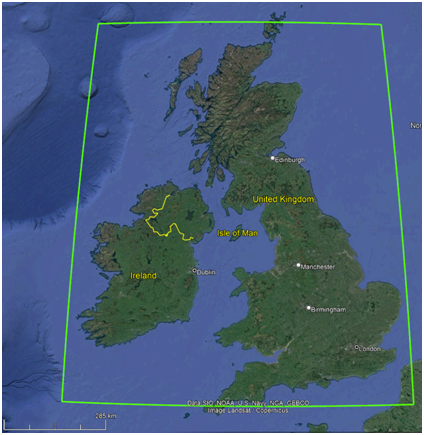
First I better define a region that encompasses the United Kingdom plus Ireland plus a good chunk of their maritime waters. Here’s the region I plonked down within the KNMI query language which should do the job reasonably well. I can change it if anybody greatly desires but chances are the results will remain the same with minor boundary changes:
When it comes to wind you can’t get any better than the ICOADS 3.0 monthly wind speed dataset, being a gridded dataset with a spatial resolution of 2° that kicks off in January 1800 and runs through until August 2023. If you’d like to fiddle with this yourself you’ll find the easiest option is to dial this up using KNMI Climate Explorer monthly observations fields. If you want easy access to daily wind speed data you can flip to downloading the E-OBS 28.0e dataset that runs from January 1980 to June 2023, this being a juicy morsel from the ESA’s thoroughly tasty Copernicus project.
In Extremis
When it comes to named storms we are talking extreme wind speeds, so it would make sense to pull down the maximum daily (E-OBS) or maximum monthly (ICOADS) wind speeds for each dataset and analyse wind in extremis. Sure, we can look at averages, and I’m expecting Met Heads to do just this but just remember that it isn’t the average wind speed that blows tiles off your roof or sends the wheelie bin down the street!
Speed Merchant
We also better be clear what we mean by ‘wind speed’. If you start prowling around meteorological datasets you’ll discover two flavours of wind speed: zonal (East-West vector) and meridional (North-South vector). Most people think of in terms of wind blowing their hat off – they don’t care about the direction of the wind, only that it is strong enough to blow their hat into the gutter. The ‘vector bit’ is when we come to assign direction i.e. angle counts. If a strong Northerly wind is blowing down the valley and rattling your windows then the East-West velocity component to that wind is zero until it changes direction. If it then blows from the North East then you’re got a vector that represents the East-West velocity and another vector that represents the North-South velocity. These vectors can be positive and negative depending on your reference frame. To simplify matters I’ve combined these into what I’m calling ‘scalar’ wind speed that offers up a single, positive value.
Monthly Series Since 1800
I don’t know about you but the thought of plotting out the monthly maximum scalar wind speed for the UK & Irish waters since 1800 gets me bouncing in my chair with excitement. On top of that I can aggregate the E-OBS daily values since January 1980 and crayon those maxima in for comparison at the same time. More bouncing! Here we go:
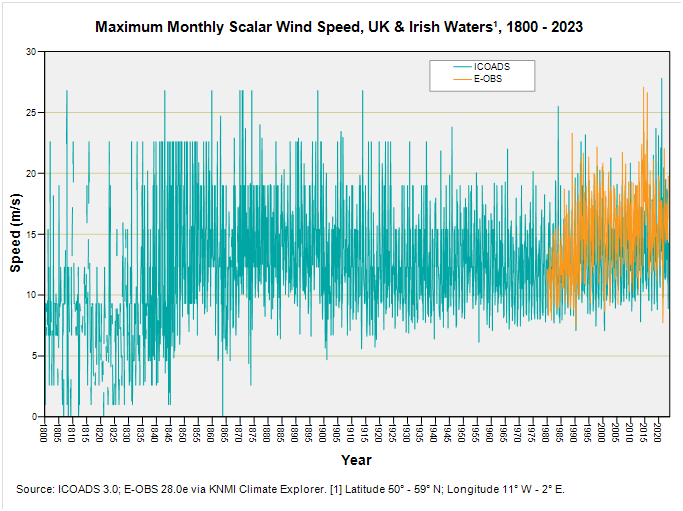
OK, so there are going to be far fewer observations back before 1900, so we better treat the early data with caution. Unfortunately there isn’t an easy way of checking the number of observations by month unless I go poking around the source files and spend a fair few hours that I don’t have - a thin caveat is all I can offer.
It’s Unnatural If You Ask Me!
Up until 1950 my eyeballs spot an unnatural pattern buried in the maximum monthly values that looks for all the world like some artificial cap on maximum speed. The most obvious of these palisades runs from 1840 to 1860, when the maximum was clearly artificially limited to 22.6 m/s. For those who desire to count in old money this equates to 50.6mph, and I shall suggest this may be a limitation imposed by the technology of the time.
Another such limit may be spotted in the most extreme values attained during 1800 – 1920, these fetching-up at 26.8 m/s (59.9mph). There’s a third set of artificially limited values running along at 15.4 m/s (34.4mph) from 1830 to 1950 and this makes one wonder just how meteorologists went about their business!
We may also ponder on how NOAA have gone about sifting through the historic data because there are forced patterns here that don’t exactly fill me with confidence. The upshot is that we have no idea of how windy it truly got prior to 1960, and this is a fatal blow to reliable long-term analysis.
This is an issue I did not expect and so I will have to continue this line of investigation in part 2. Meanwhile, what we all need to bear in mind if woke BBC environmental correspondents open their mouth is that we don’t have reliable records prior to 1960 so cannot determine whether recent wind dynamics are unique or something we’ve seen before. That goes for any expert the BBC churnalists care to interview who may chunder on about climate change bringing devastation.
Indeed so, for my eyeballs suggest a windier past to which we may be returning but I better try a few more analyses to get a better grip. Here’s what happens if I average the monthly ICOADS values over the year and remove years with missing monthly data:
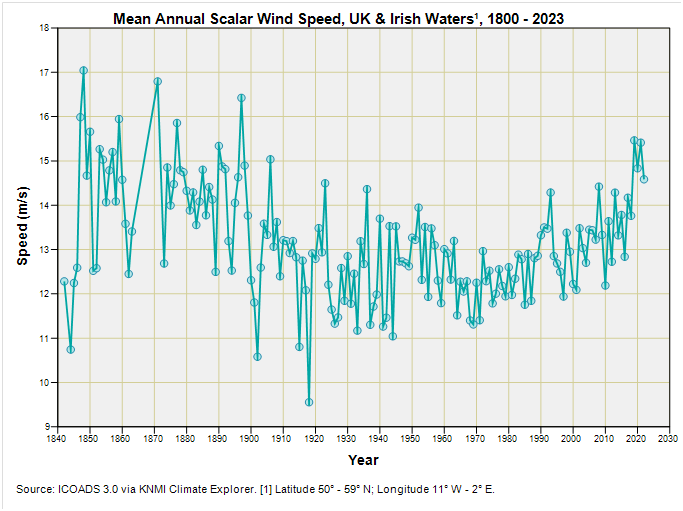
There we go! The real story would appear to be a windier past to which we are simply now returning in some cyclical fashion. What’s the betting that experts are going to start their analyses in 1970 or even 1980? I’m going to put money on experts mouthing off about the latest and hottest Copernicus data arising from the European Space Programme because this starts in 1980 and is thus mighty convenient for alarmism. Here’s an equivalent slide for the E-OBS dataset showing just how scary climate change can appear to be if you cherry pick:
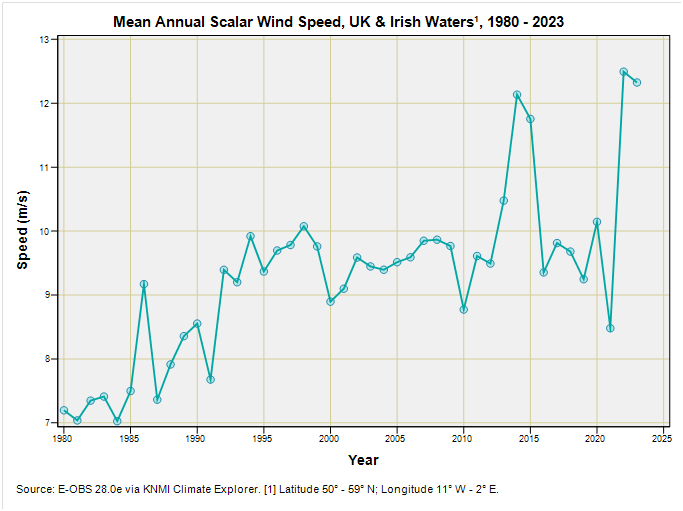
There we go – absolute proof from the very expert bods at the European Space thingy that things are getting worse and that it may already be too late to save ourselves and the planet even if we abandoned fossil fuels this year and froze/starved to death. I am going to bet good money that this is the dataset they are going to ramble on about in the MSM (look for the keywords Copernicus/ESA/E-OBS in any forthcoming article). If they were interviewing me and I’d made my academic career out of alarmism I’d say something like this…
“the latest satellite records tell us mean wind speed for 2022 was 12.5 m/s – the fastest on record to date. Mean speed for 2023 was already up at 12.3 m/s back in August so we are set to break all speed records this winter. It may be already too late to stop devastation from hurricanes being a regular feature of UK life.”
…and a large number of people would be riddled with fear so great they’d accept any draconian measures from the government that would take away their freedoms, livelihood and financial future in exchange for vaguely worded promises of ‘climate action’. A splice to footage of hurricanes like Katrina, Ivan and Gilbert with an overdub of “and it is scenes like this that experts say the UK is now heading toward” and it’ll be job done. Nobody will ask the obvious question, “what was wind speed like before 1980?”, and I doubt that any expert will come clean on historic data inadequacy.
Well, dear readers, that’s about all I have time for today – a much-needed G&T calls and I need to get stuck into that queer business of truncated values for maximum wind speed prior to 1960. Nothing is ever as it seems (apart from gin).
In this article I’ve had a look at maximum wind speed as a measure of ‘climate severity’; in part 2 I’ll be looking at the incidence rate of extremely windy days/months over time to get a feel for frequency of named storms before names were a thing. Then, if possible, I need to tackle how windy it really got prior to 1960.
Kettle On!
Would you believe it truncated data. Well spotted. Data doesn't lie.... Only what's done with/to it!!
Wind measurement is a multidimensional problem compared to temperature measurement and we can’t seem to get that right. I guess the historical database is recording anemometer readings at the weather stations. But wind is subject to gusts (sudden variations in speed), shear (altitude effects) turbulence and wake effects (from surrounding objects). Modern Lidar can produce a 3D topological map of the wind at different sites but these won’t be consistent with earlier time series of anemometer readings. I think you’re going to need a lot of cakes for this series!