
Not Gone With The Wind (part 1)
With UK named storms all the rage (see what I did there?) and the Met Office keen on scaring folk into futile carbon compliance I take another squizz at historic wind speed for our inshore waters

Down here in the deep south of Engerlund we’ve just experienced Storm Henk. Before Storm Henk we experienced Storm Gerrit. Before Storm Gerrit we experienced Storm Fergus. Before Storm Fergus we experienced Storm Elin. Before Storm Elin we experienced Storm Debi. Before Storm Debi we experienced Storm Ciaran. Before Storm Ciaran we experienced Storm Babet, and before Storm Babet we experienced Storm Agnes. Coming up next will be Storm Isha.
During all these storms I can report that our twin wheelie bins (a green one for household refuse and a brown one for garden waste) have not moved one inch. Neither have our brown kerbside food waste bin, our green box for bottles, our black box for cardboard, and our blue bag for plastic waste all gone sailing down the road. I shall prove this with photographic evidence taken at 12:12GMT on Wednesday 3 January 2024 using the Dee mobile:


All bins are present and correct despite the passing of nine named storms. It is worth noting that these brave bins are located on driveway on the weather-beaten side of the house where the wind funnels between neighbouring mansions. It is also worth noting that we haven’t found pieces of cardboard flying down the road despite the black bin being open to the elements and held together with gaffer tape.
What does this mean?
It means our bins have not gone with the wind. It also means the Met Office storm naming and warning system is a crock of hot air.
I am old enough to remember when the system was introduced in 2015. A spokesdrone for the Met Office mumbled something at the time about raising public awareness about weather and its impact (as if the public hadn’t realised this for themselves in these windswept islands over the last few thousand years). They must think we were born yesterday! The official excuse is given as follows:
The naming of storms using a single authoritative system provides a consistent message and aids the communication of approaching severe weather through media partners and other government agencies. In this way the public will be better placed to keep themselves, their property and businesses safe.
The implication of this thin paragraph is that we weren’t safe before 2015, and none of us watched the umpteen daily weather forecasts on the TV or listened to the BBC R4 shipping and inland waters forecast on the radio in LW and FM (ditto the umpteen commercial FM station summaries), or surfed the internet for weather information, or used a weather widget. Neither did any business whose business it is to keep an eye on the weather through supplied Met services bother to take notice of the plethora of expensive data at their disposal. Nor did any individual or organisation going about the world pay attention to weather radar and various automated sensors whose output is disseminated in a myriad ways and available at the touch of a screen. No indeedy; we did none of that, apparently, and blindly waded into danger each year.
What was needed to finally shepherd the public to ‘safety’, it seems, was a lame name system of the sort that is eminently suitable for the brainwashing of the nation via social and legacy media. As a result named storms are steadily entering public consciousness (you can tell by eavesdropping on bods sipping pints at the bar), and before long I predict that named storms will be subconsciously associated with the fear response owing to the psychological tricks that will be employed by the behavioural nudge units. Gone will be living memory of what actually happened each storm season and, instead, folk will come to think what they think because their phone/TV/newspaper/widget is providing a carefully crafted narrative for them. Be careful with your bins, darling, and do count your roof tiles this week; oh, and please don’t drive through floods or visit the pier: weather is so very bad for your health!
As Hermione Granger says in Harry Potter And The Chamber Of Secrets, “fear of a name increases fear of the thing itself”, being a splendid truism that we may all witness on a daily basis if we took a step back and observed ourselves. Those not sure of the power of words (and therefore the act of naming storms) might like to take a course in psycho-linguistics like wot I did as a whippersnapper – dare I say I was… spellbound?!!!
Wheelie bins aside avid readers will have noted all this and more before in my three part series Putting The Wind Up… but with the current media onslaught aimed at using the endless repetition behavioural modification trick I felt I ought to do the same by way of a quick rehash using the very latest dollop of data.
A Decent Dollop Of Data
This is where a decent dollop of freshly churned data comes in for those who are sufficiently conscious to seek a perspective. Getting that dollop from UK inland stations for wind speed is fine if you want to restrict observations to the last 40 - 60 years but not so fine if you want to push back to 100 years and more. This is where our maritime heritage comes into play for we discover wind was, and still is, a big deal for shipping in the UK and elsewhere. Enter ICOADS (International Comprehensive Ocean-Atmosphere Data Set) where we may seek values for wind speed dating back to January 1800, and which may be accessed at the touch of a button using KNMI Climate Explorer.
But first we must define a couple of things. We need to define the UK and its inshore waters, for which I have plonked down this crude query grid:
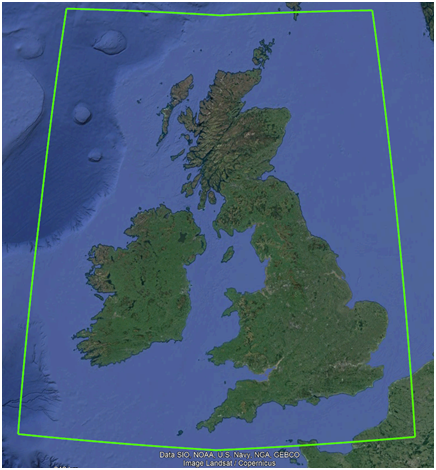
We then need to define what we mean by wind speed. This sounds a bit daft until we realise there is zonal wind speed and there is meridional wind speed, these being the two primary vectors (u, v) used in meteorology. For zonal (u) think East-West or West-East wind velocity component, and for meridional (v) think North-South or South-North wind velocity component. Those who enjoy geometry will realise we can combine these two orthogonal vectors into single value using a bit of Pythagoras (A² = B² + C² and all that); I’m calling this derivation ‘scalar’ wind speed. As bods with sticky-out ears and noses we don’t generally care where the wind is coming from, only that it is windy to merit a hatpin. Those who wish to try this numerical exercise for themselves may find the source data here and here.
One last point to note is that I’ve opted for maximum value of the mean gridded wind speed rather than the mean value of mean values in order to identify the windiest zones. ICOADS is a gridded product with a resolution of 2° x 2°, with each grid offering a mean value derived from many observations (mainly ships logs but also buoys and land stations). The nominal UK inshore waters boundary shown above straddles 35 such grids and by specifying the maximum mean we get to see just how windy one of those grids got instead of averaging the whole lot into a single, bland aggregate value. This is the nearest we can get to the absolute maximum wind speed recorded in any one month, so please bear this limitation in mind when gawping at figures that only manage to reach 50 – 60mph; that’s 50 – 60mph on average: sustained absolute maximum speeds attained could well be in excess of 80mph with gusts exceeding 120mph. No matter, though, for as long as the analysis is internally consistent we’ll get a good idea of what has been going on!
Historic Wind Speed: UK & Irish Waters
If we restrict the sample to the period January 1850 – October 2023 we obtain the following summary statistics:
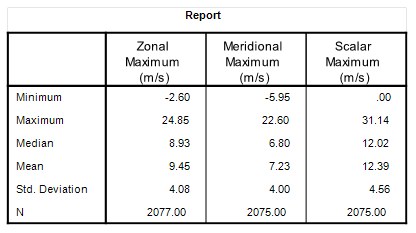
The first thing to note is the bias toward positive zonal and meridional wind speeds, which is telling us that the wind generally rips into the UK from the Atlantic, passing from the South West up to the North East. The maximum mean speeds observed during this sample period are 24.85 m/s (55.6 mph/89.5 kmh) for zonal (West to East) and 22.60 m/s (50.6mph/81.4 kmh) for meridional (South to North). These were attained during December 1869 and February 1922 respectively, which makes for a rather controversial start!
As regards my home-baked scalar maximum, that summed vector component of 31.14 m/s (69.7mph/112.1kmh) was attained during January 1871. It was real windy back then but don’t expect the Met Office or handsomely paid expertistas to go blabbing about this.
As for defining storms I am going to suggest we adopt the 95-percentile approach, which yields thresholds of 17.33 m/s for zonal, 14.52 m/s for meridional and 20.77 m/s for the scalar series. When these are used to derive an indicator variable for incidence storm force winds we get 104 incidences for zonal wind and 103 incidences for meridional wind over the period January 1850 to October 2023. Let’s have a look at the distribution of these over time whilst the oven is still hot:
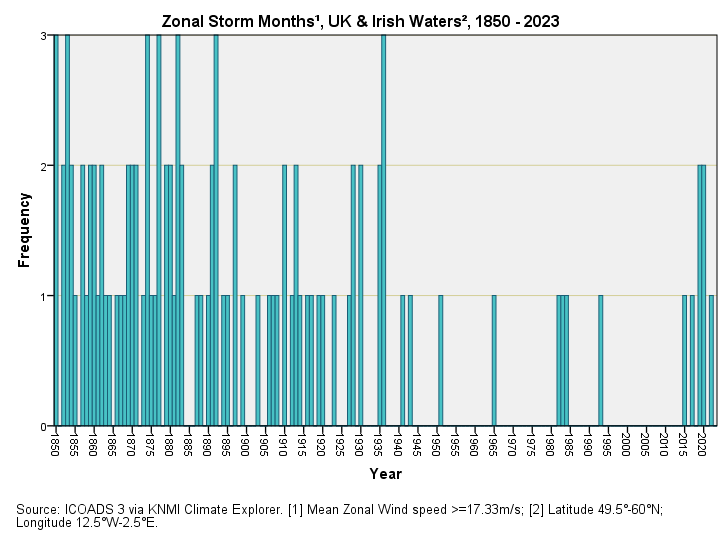
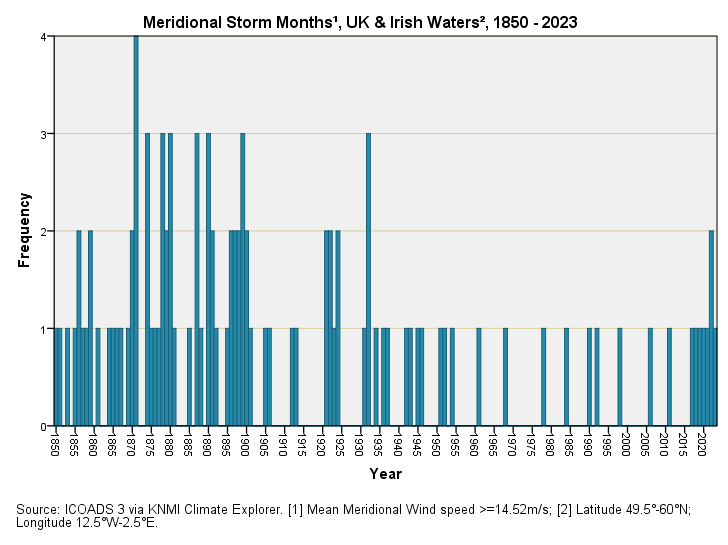
Now isn’t that darned interesting? If we ignore data before 1940 then it sure looks like storm force zonal and meridional winds are on the increase. What’s the betting that the Met Office and other expertistas around the globe are going to start their analyses from 1940 onward? Particularly evil globalista scientists will start their analysis from 1970.
I’m going to wager good money that big mouth result wanglers blabbing on about increasing risk of storm force winds (according the latest state-of-the-art technology, no less) are going to use the European Space Agency E-OBS dataset and the Copernicus satellite platform data products (‘Europe’s Eyes On Earth’). Except that the E-OBS v.28e wind speed dataset only stretches back to January 1980 – what a spectacularly alarmist feast awaits them! What grant awards! What prestigious publication! Except that you now know better.
You now know that storm force winds were far more frequent prior to WWII both in terms of extreme zonal velocity and extreme meridional velocity. I can do some formal stats tests to prove this but, TBH, they are pretty pointless with such a clear distinction in the pre- and post-war distributions of extreme wind incidence. Nevertheless, being a geek-nerd and waiting for the kettle to boil, I decided to furnish a table of counts by (full year) period so we may wield the spanner that is significance testing for comparison of Poisson rates:
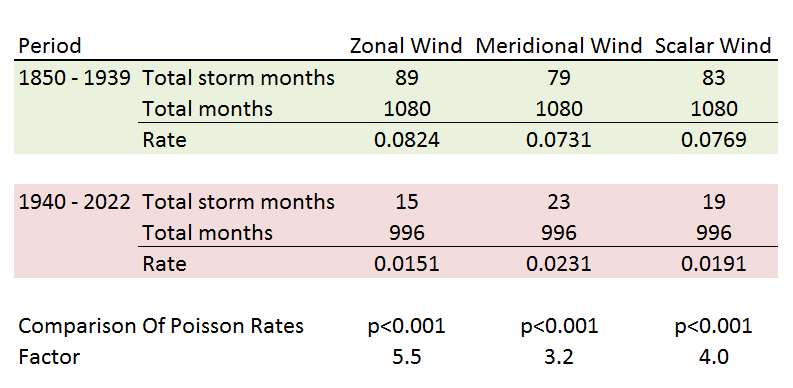
Told you so! In terms of zonal wind speed the incidence rate for storm force months for 1850 - 1940 was 5.5 times higher than that for 1940 - 2022 (p<0.001); this is going some! Even the weaker meridional wind vector manages a tad over three times the rate (p<0.001). Make no mistake it was way, way windier way back, but the public are not going to be told this. This ain’t any old data neither; we’re talking ICOADS!
Whilst there is no doubt that we’ve experienced a recent cluster of storm force winds this is nothing unusual and we’ve been here before, and then some. If nothing else this is the message you need to take home today to cushion yourself against the named storm media onslaught.
Another way of looking at the pre-1900 tally is that the UK experienced the greatest number of storm force winds back when the horse and cart was in fashion and steam railways were just starting out. Those big winds died down as the industrial revolution got going, reaching rock bottom when fossil fuel use ran riot after WWII, which is rather ironic. Only in the last five years have those big winds started to return. And all this is due to anthropogenic global warming arising from mounting atmospheric carbon dioxide and cow farts, apparently. How utterly pathetic.
Scattered Plots
We’ve looked at incidence so we better now take a look at degree – are winds getting faster? This requires use of a scatterplot upon which I crayon the maximum mean monthly gridded wind speed recorded in any one year, this being the closest I can get to the absolute maximum wind speed. Hopefully these will satisfy the “yes, but…” brigade. Try these for size:
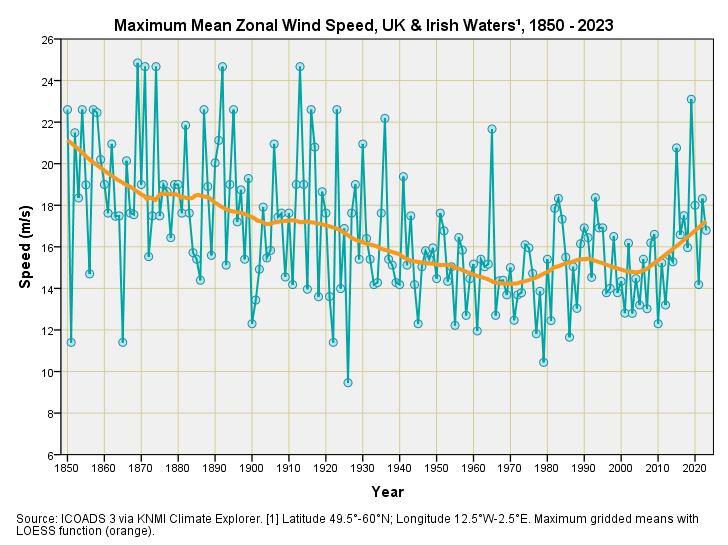
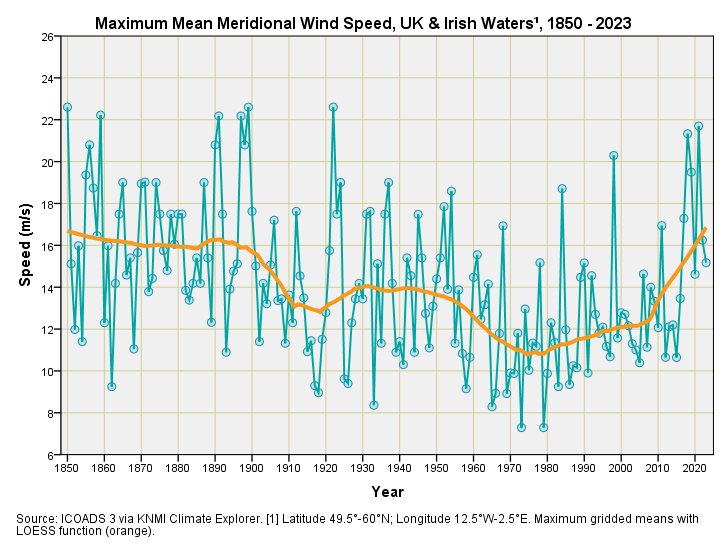
So yes, the maximum mean gridded wind speed – both zonal and meridional – has been increasing since 1970, and no doubt alarmists will latch on to this story. What they’re going to ignore is the historic decline in speed from 1850 onwards, along with incidence of storms.
If you do bump into an E-OBS expert blathering on about wind speeds increasing over the last five decades please do ask them what transpired prior to their fancy but statistically flimsy dataset.
With a sufficiently narrow window of view you can claim the Earth is flat and seemingly prove it.
Kettle On!
Very interesting!
You mentioned Pythagoras' Theorem. I wasn't all that good at maths but, thanks to a brilliant teacher, managed to pass the exam ('O' level that is, if anyone remembers those exams before they became GCSE).
This is the story that wonderful teacher told us:
Once upon a time there were three Indian squaws who all happened to be pregnant. They all gave birth on the same night.
The first slept on a buffalo hide and gave birth to a boy.
The second slept on a deer hide and had a girl
The third slept on a hippopotamus hide and had twins, a boy and a girl.
So the squaw on the hippopotamus equals the sum of the squaws on the other two hides.
Simples!!!
The statistics speak defeats me, but psycho-linguistics sounds fascinating. Using data over a long time (and I daresay in historical terms it's actually quite a short time) seems a very obvious thing to do.