
Cheeky C(h)MIP (part 1)
Pilfering the CMIP6 atmospheric CO2 data

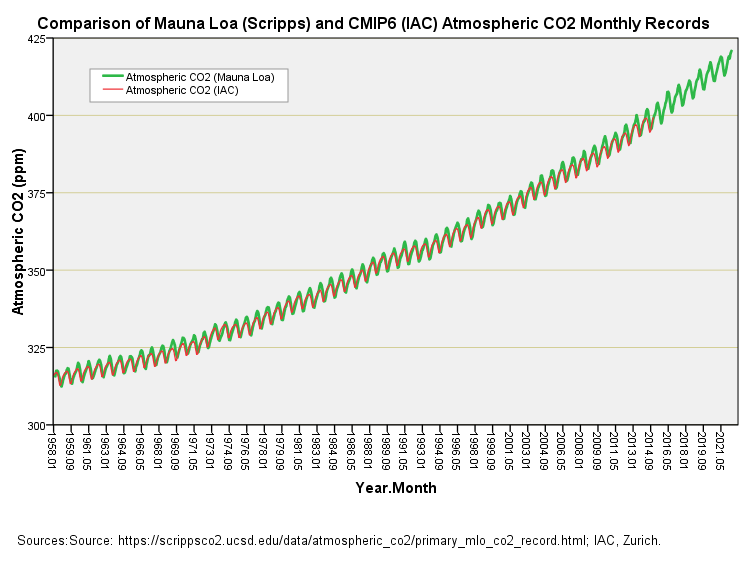
In HADCRUT Global Temperature Anomaly (part 1) I introduced folk to the world reference atmospheric CO2 laboratory at Mauna Loa, a rather big, belching volcano in Hawaii. No sooner had I done this when I launched into a scatterplot of the HADCRUT5 global temperature anomaly plotted against atmospheric CO2. But I am forgetting my manners, and so today I shall formally introduce you to the monthly data series produced by this facility. Here it is:

We may note it kicks-off in March 1958 and bends slightly upward, revealing acceleration in the CO2 record. We should also note the jagged pattern, this being the seasonal variation in CO2.
Atmospheric CO2 reaches a peak during winter when the deciduous forests of the Northern Hemisphere shed their leaves and stop converting CO2 into sugars and starches, and when evergreens take a snooze during the colder winters. Despite Mauna Loa being stuck over in the Pacific at 19°32’N, and +3,700Km from the nearest substantial landmass, this natural pattern is so strong that it dominates the global record. I’d like subscribers to remember this fact because we are going to bump into it in a future newsletter!
The Snatch
The period 1958 - 2022 may sound like a long time to folk but when it comes to measuring climate processes we really need to snigger in our sleeve. Besides which, there are highly polished temperature anomaly data dragging back to Jan 1850; 108 years seems like an awful lot of waste!
This prompted me to hunt around for the CO2 input record for CMIP6. CMIP6 is the latest incarnation of those rather expensive and very flashy Earth systems models that top notch climatologists swear by, rather than at. Results of these from leading players such as NASA, NOAA and Berkeley are pooled by teams of suits working for the IPCC, who then write very thick and glossy Assessment and other Reports. These are the reports that politicians will wave about in the air demanding action from their respective Parliaments and Senates in moving Net Zero forward at all costs. They are thus VERY important reports, and the data used for them will have been groomed to a perfect shine, for it is very important data.
I found the very important data for atmospheric CO2 lurking on servers at IAC, Zurich. The link currently doesn’t work but you can try it by clicking here. Back in Dec 2019 I managed to download the file whilst it was still possible to anonymously access the ftp server.
Funky or what?!
The CSV source file is so funky that I’ve plonked a copy on my shared Google Drive for your amusement. Please do take a peak for you’ll see estimates of atmospheric CO2 to 12 decimal places (yes, that’s 12 decimal places worth of precision, folks!) stretching back to January of the year 0BCE (which doesn’t exist). Back then Tiberius - under command from Emperor Augustus - smacks the bad folk of Germania, and Confucius is bestowed a royal title. They would have both been thrilled to learn that CO2 for the Northern Hemisphere kicked-off nicely at 278.555895908363ppm for January of 1AD. IAC say so, and so it must be.
There are a few surprises hidden in this funky file that I shall reveal in forthcoming newsletter but right now we need to get to the nitty-gritty and compare values with the Mauna Loa series from 1958 onward. Try this for size:
You can bet your last dollar that very important climate data from the big players is going to tell the same story. From my point of view this makes my job much easier and so is a welcome relief, for it means I’ve now got a CO2 record stretching back to 1850 when the key temperature anomaly series start. Here’s what that looks like…
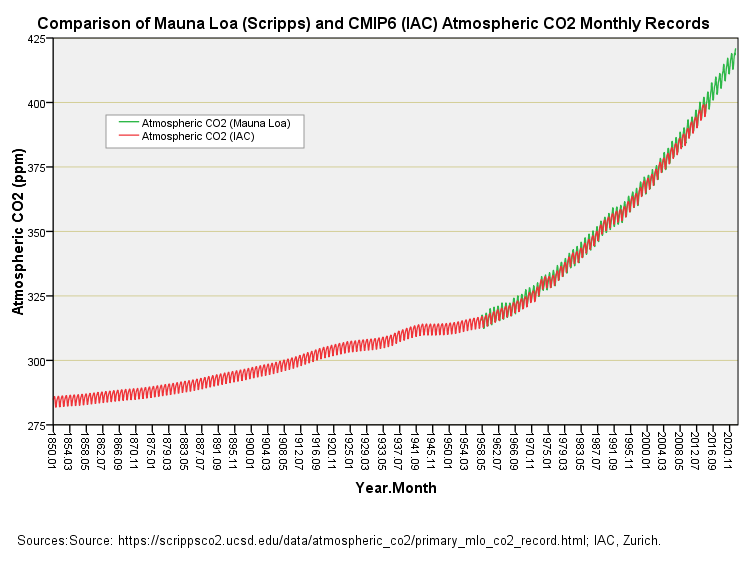
In my next newsletter we’ll have a look at what IAC think CO2 has been doing for the last +2,000 years. I suggest you wear a bib because the risk of blurting your tea out is rather high.
Kettle on!
Well John you bring Confucius into the subject - and of course many of his quoted sayings are apocryphal, but one I believe he did say is -
"Real knowledge is to know the extent of one's ignorance"
Climate science should dwell on that.
Looking forward to the info. Many years ago I saw the "hockey stick" temperature chart. Thought I'd look at the latest chart. Though still discussed 2020/2021 it is always the same chart that cuts off at 1998. Havent they ever updated their infamous work?