
Central England Temperature (part 5)
A sideways look at the longest instrumental record of temperature in the world

In part 4 of this series I came out batting for alarmism by producing a scatterplot of central England mean annual temperature (HADCET) against atmospheric CO2 concentration for the period 1659 - 2021, and by assuming warming was due to human emissions and only human emissions.
Three mathematical models were considered (linear, nonlinear and log-linear) and fitted to the data cloud using linear regression. Three equations were presented for the numerically-minded, with the results also being plotted out graphically.
We discovered that the three model forms produced very similar fits to the data for the range of CO2 concentrations considered (275 - 420ppm), and I promised to crayon plots out to 500ppm, 1,000ppm and even 4,000ppm in order that we may ascertain just how well roasted we are all going to be in the future if we took each model form and alarmist claims as the gospel truth.
We shall start out this chilly UK morning (1.5°C according to my North wall outside thermometer) by gawping at three possible warm futures for an eventual CO2 concentration of 500ppm, pausing to note that the US is currently experiencing record cold and record snow despite atmospheric CO2 being up at 417.37ppm last Thursday.
Try this for size…
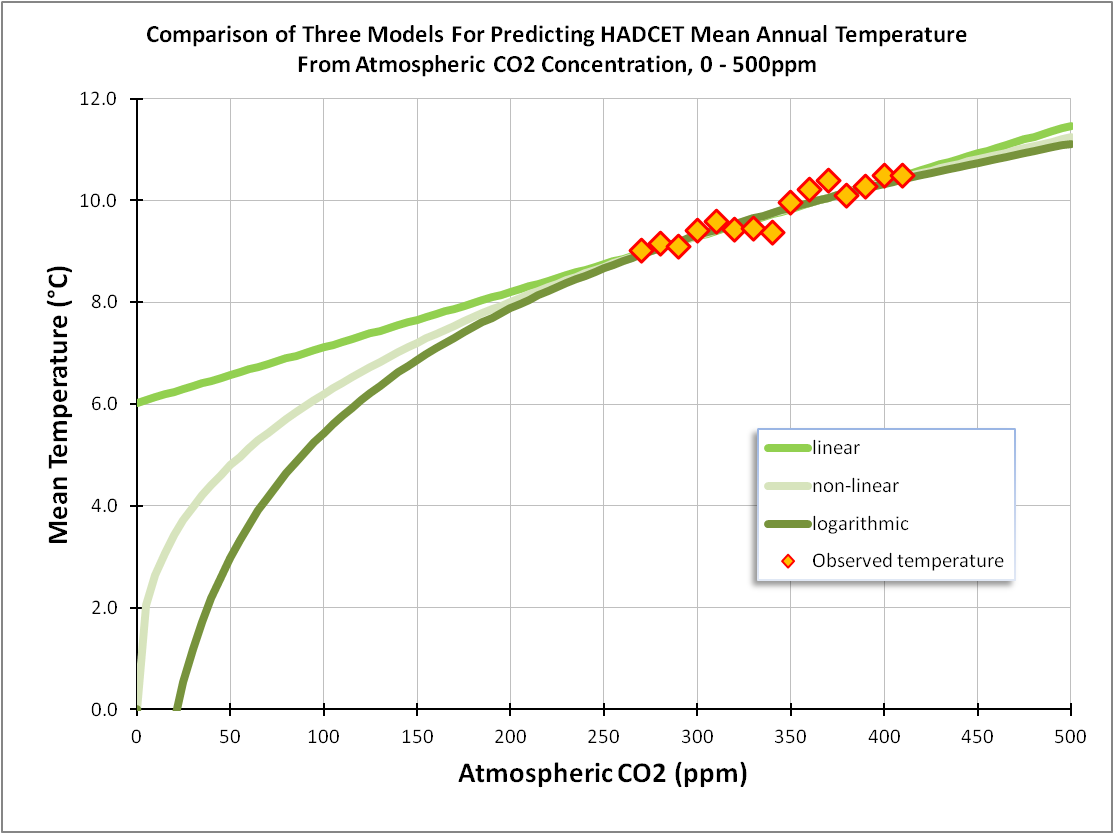
It should be abundantly clear that over the range of observed CO2 levels all three models pretty much do the same thing. They also pretty much do the same thing out to 500ppm, some 82.63ppm further on from where we are now, it being the bottom end where things shake up somewhat. In terms of tracking the theory the log-linear model comes out best as it swoops down to -10°C at zero CO2. So far so good but what about the future for 1,000ppm?
Now try this for size…
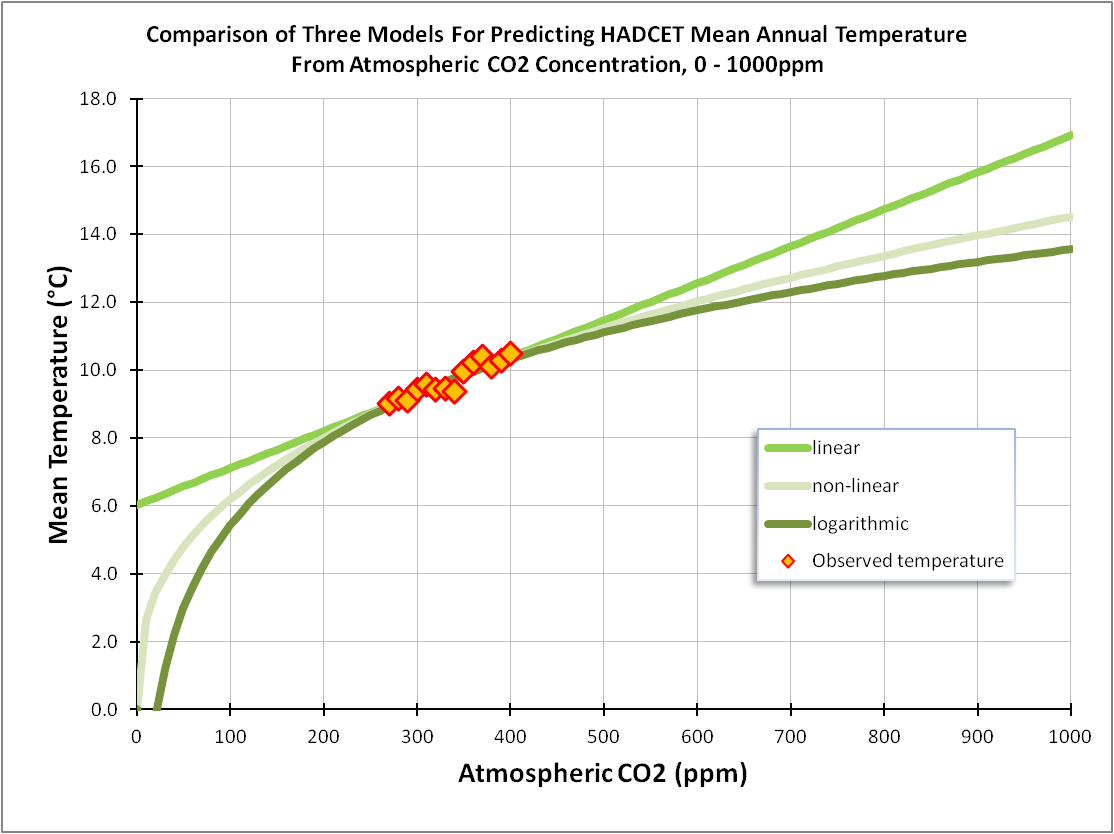
We start to see the three models diverge to predict three different futures. The poor relation here is the linear model, whose simplicity might do justice to data gathered over a narrow band of CO2 concentrations, but whose predictive ability is somewhat lacking (unless you wish to push alarmism). We may wonder just how many alarmist predictions are dependent on similar linear thinking, as exemplified by the caveat, “if emissions continue at this rate...”
There’s that little word ‘if’. You may also have spotted judicious use of the words ‘maybe’, ‘possible’, ‘believe’, ‘think’and ‘claim’ in journalistic reports of climate research. For some reason the public view these as delineating statements of fact rather than the speculation. This is a convenience for governments who rely on public apathy and ignorance.
A final fitting…
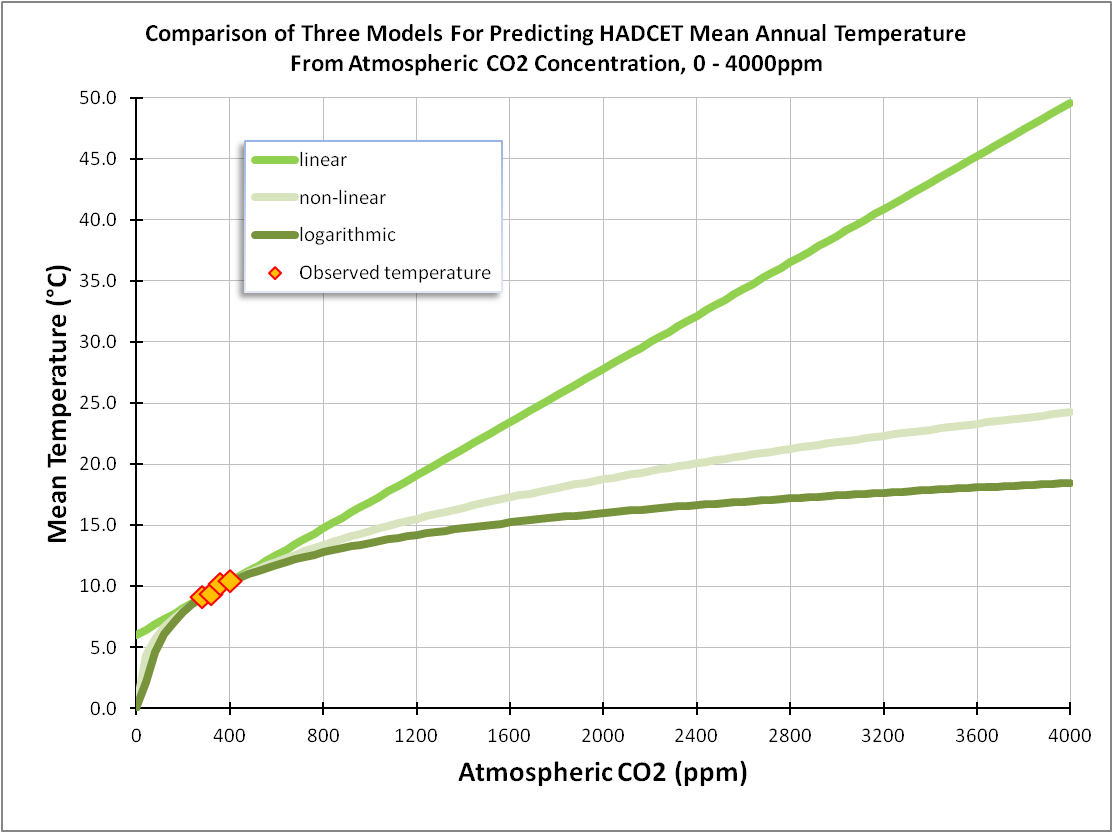
We’re now out to 4,000ppm. According the the very best alarmism we should all have baked to death by now, with runaway global warming evaporating the oceans into space. The Earth should be a dead rock populated only by bacteria, fungi, lichens and perhaps a few hardy critters like termites.
The interesting thing here is that this scenario is best matched by the linear model, which predicts a formidable mean temperature of 50°C at 4,000ppm. A snag is that back when the Earth actually experienced 4,000ppm mean global temperature was only 14°C higher than today, and not 40°C higher as predicted by the linear model:
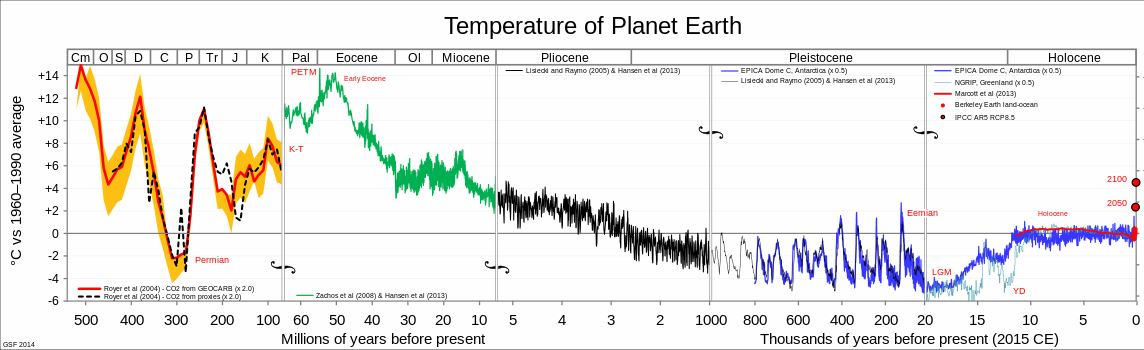
OK, so we better junk the idiotic linear model (but be careful to check alarmist claims for linear assumptions!). This leaves us with two models that tell a very different story. Given the strong loglinear relation for observed data, and given a loglinear model gets closer to the theoretical zero CO2 global temp of -20°C then I would suggest this is the model to put our money on.
With bets placed (for all modelling is a gamble rather than gospel) we observe a remarkable and most substantial saturation effect for CO2 such that, even at a giddy 4,000ppm, greenhouse warming - according to this model - can only achieve 18.5°C at best, some +8.5°C above where we are today.
Will a hike of 8.5°C in the mean temperature record result in total and utter catastrophe? I doubt it, for the Earth tends to spit out new species when conditions for evolution are as favourable as this. Nature will take advantage even if our civilisation fails miserably to do so over the decades that must pass.
For some inexplicable reason our governments, their experts and associated mentally-disturbed pressure groups all fail to acknowledge human adaptability, human flexibility and human ingenuity in the face of planetary changes. It is as though they are at war with humanity.
Tracking our every move, restricting speech and freedoms, hiking taxes, and restricting the energy supply, food supply and creative thought is their collective idea of a technocratic solution that is supposed to somehow protect the environment and ourselves. I suspect our chances of long term survival as a species would be far better if we ditched globalist efforts and braced ourselves for a 3mm per year sea level rise. I’m sure we could all chip in to buy a few sandbags.
Kettle On!
Sadly the media give us little more than propaganda to fit the narrative. Thank you for this interesting series.
I am feeling very down & despondent. I ranted about the stupidity of the AGW/CC nonsense over 20 years ago to my various family, social & work circles. Arm waving embraced the inevitable consequences of power cuts, rising prices & inability of any British manufacturing industry to compete. All that I actually managed to do was to confirm my status as a swivel eyed loon who had spent too much time paying attention to maths, science & history lessons in school.
When the covid racket started I saw an astonishing number of parallels and ranted (albeit on slightly different things), again from a scientific basis. This time around, as well as being the swivel eyed loon, I was ostracised, banished & insulted for not buying into any of the bolleaux, refusing to wear a nosebag or take any of the jabs.
Your pieces are wonderful & make me feel a little less lonely but do nothing for an ever declining opinion of my fellow man. 90%+ of the world's population has revealed itself to be terminally stupid. Here comes the 'but' . .
Some years ago I read a number of papers by Maynard Smith. A very interesting bloke with a fascinating background, he applied maths & modelling to evolution. IIRC, every scenario showed that 'seekers after the truth' became extinct. The survivors displayed 'fitness'. Maybe the smart money has managed fitness by doing the virtue signalling thing, worshipping Greta Thunderberg, Al Gore etc. & yet dodge the jabs, retain access to energy, food etc.. There are only 2 ways I can see how to do that:
1) Be *very* rich, like Gates & his WEF cronies. Pose, posture, preach & pontificate accordingly before boarding your private jet.
2) Somehow wheedle your way into WEF/UN/WHO etc. as a hanger on & pose as a useful idiot.
I saw that the COP junket attracted 47,000 attendees. WHO & other UN jamborees have similarly huge numbers. How do us wee people get a ticket? In memory of the boys from the black stuff, "Gissajob" - in the modern global public sector.
Doubtless I probably missed something more achievable. What was it?