
Central England Temperature (part 4)
A sideways look at the longest instrumental record of temperature in the world

In part 3 of this series I promised to come out batting for the other side. I shall take alarmists at their word and derive predictive models for the central England temperature record using nothing but atmospheric CO2 from 1659 onward – you can’t get simpler than that!
We shall start straight in with a scatterplot of the central England mean annual temperature (HADCET) plotted against atmospheric CO2 for the northern hemisphere (please refer back to part 1 for details, sources etc):
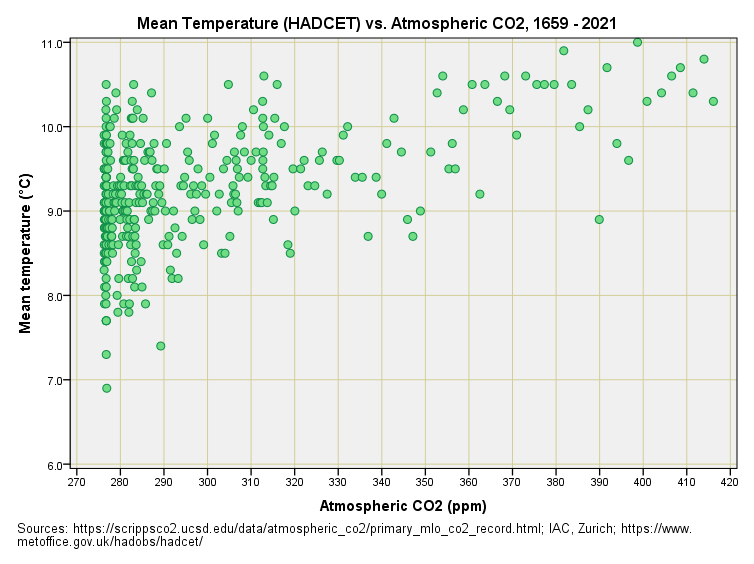
There we have it. There is a positive relationship for certain but is this the result of CO2 driving temperatures or temperatures driving CO2? Or could it be something else entirely – like solar particle forcing, for instance? Whatever the causal mechanisms (I presume there’s more than one) if we are going to predict the future we are going to have to model this scatter of historic data points some way or other, and with a vast number of model forms to choose from that task is going to be tricky.
Linear Thoughts
The usual starting point is to plonk a straight line down using the technique of linear regression. This is a mighty useful tool and you’ll find it splattered everywhere but it is arguably the most abused tool in statistics, since the real world rarely walks in a straight line even when not intoxicated. There are plenty of solid reasons for a wonky walk starting with saturation, compression and non-linear dynamics. All of these real world considerations and more are swept aside when we get our rulers out and draw a dead straight line though the data cloud. These might look appealing, and are intuitively easy to grasp, but their use implies constancy of relationship into the far future. If you want to scare people into boiling or freezing futures then straight lines are perfect for snake oil salespersons.
For the numerically-minded I shall reveal that ordinary least squares regression yields the following linear equation (R-square = 0.256):

Thus, we observe a constant land surface temperature of 6°C in the absence of any atmospheric CO2, with a 1.1°C rise in mean temperature for every 100ppm of the gas (p<0.001). That estimate of 6°C is way off the big bod estimate of -20°C for a zero CO2 atmosphere, so this model doesn’t promise much that isn’t snake oil and scare factor and I shall plot this function out a little later.
Log-linear Thoughts
A fair few climate scientists with impeccable credentials claim the relationship between CO2 and temperature is log-linear. That is to say atmospheric CO2 is rising exponentially whereas land surface temperatures have been rising in a sober and somewhat linear fashion. This argument has much merit because we can plot out the exponentially exploding CO2 curve and stick it next to a sombre temperature series like this:
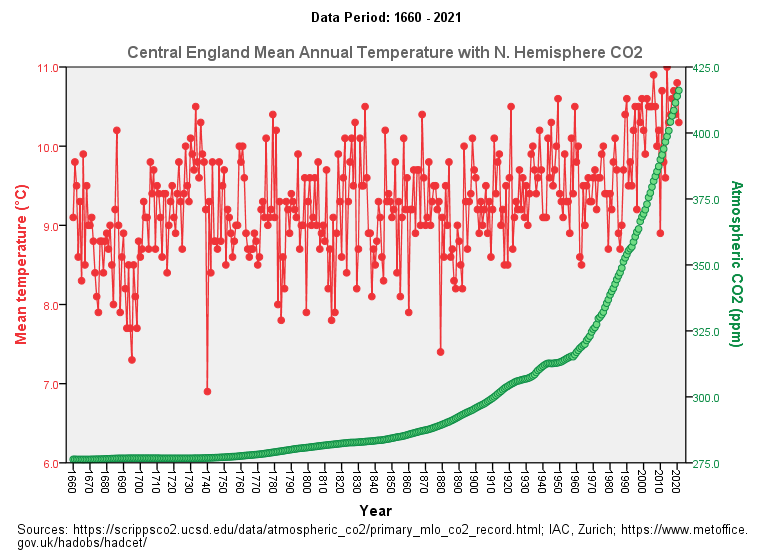
That’s pretty darn convincing, so a log-linear relationship is what we should place our money on. The interesting thing about a log-linear relationship is that it means it is taking more and more CO2 to raise global temperature by the same amount each decade; that is to say, global warming is running out of steam whether man-made or not!
A log-linear relationship bit sounds well geeky but it has tremendous implications for both climate science and climate politics since these predicated on the assumption that we are making accurate predictions of future global temperatures. Log-linear means things will not go on rising at the same rate and thus runaway global warming is a theoretical fantasy (though we all should have realised that when we estimated historic levels of CO2 to have reached and exceeded 4,000ppm).
For the numerically-minded I shall reveal that linear regression yields the following log-linear equation (R-square = 0.255):

Thus, we observe a constant land surface temperature of -10.84°C in the absence of any atmospheric CO2, which isn’t that far off the estimated -20°C for a zero CO2 atmosphere. This predictive model is promising and I shall plot this out later.
Nonlinear Thoughts
If linear can be thought of as a rigid relationship, and if log-linear can be thought of as a curvy relationship then nonlinear can be thought of as a wonky relationship. Anything goes, and we can dream of all manner of exotic function. Some examples of non-linear functions are Gompertz, Johnson-Schumacher, Michaelis Menten and Weibull.
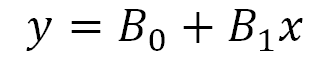
If we have access to a nonlinear modelling package like wot I’ve got then we can do something very cunning and that is to start with a simple linear equation in which values of ‘x’ are restrained to be just themselves as they are (i.e. raised to the power of 1.0):
…then take the restraining bolt off by allowing the series for ‘x’ to take up any power value it fancies by including a third coefficient ‘B2’:
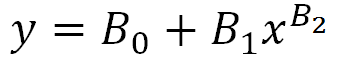
If ‘B2’ takes up a value close to 2 then we’re looking at a squared series for ‘x; if ‘B2’ takes up a value close to 3 then we’re looking at a cubed series for ‘x’. The same goes for square root (B2 = 0.5) and cube root (B2 = 0.333). By submitting this second equation in a nonlinear regression procedure and allowing the data to speak we can determine whether the scatter we observe is best explained by a linear model (B2 = 1) or something else entirely.
Just to be certain that we are all on the same page then for this article mean annual central England temperature measures are the ‘y’ values and atmospheric CO2 measures are the ‘x’ values.
Now here’s the interesting thing… when this nonlinear model was applied to the data cloud we see in the slide above the constant B0 dropped out, the coefficient B1 took up a value of 1.129 (p<0.001) and the coefficient B1 took up a value of 0.370 (p<0.001). This is utterly fascinating for we arrive at the following nonlinear equation:

The first thing to note here is that lack of a constant means when atmospheric CO2 is zero then the mean annual temperature will be zero. This is a good start but not good enough because it’s nowhere near that big bod -20°C for zero CO2. Another feature of interest is estimation of B2 as being 0.37, this not being far away from the cube root of 0.33. Cube roots are interesting for they have a volume/3D feel. More important that this wild speculation is the fact that any value of B2 less than 1.00 denotes a saturation effect - in this case a heavy saturation effect - so I shall plot this model out along with the previous two efforts right this minute!
This Morning’s Tray Bake
And here it is, fresh from the oven! There’s our scatter of HADCET mean annual temperatures for the period 1659 – 2021 paired up with IAC/Scripps estimates for atmospheric CO2 concentration like somebody dropped a box of Kellogg’s cornflakes on the kitchen floor:
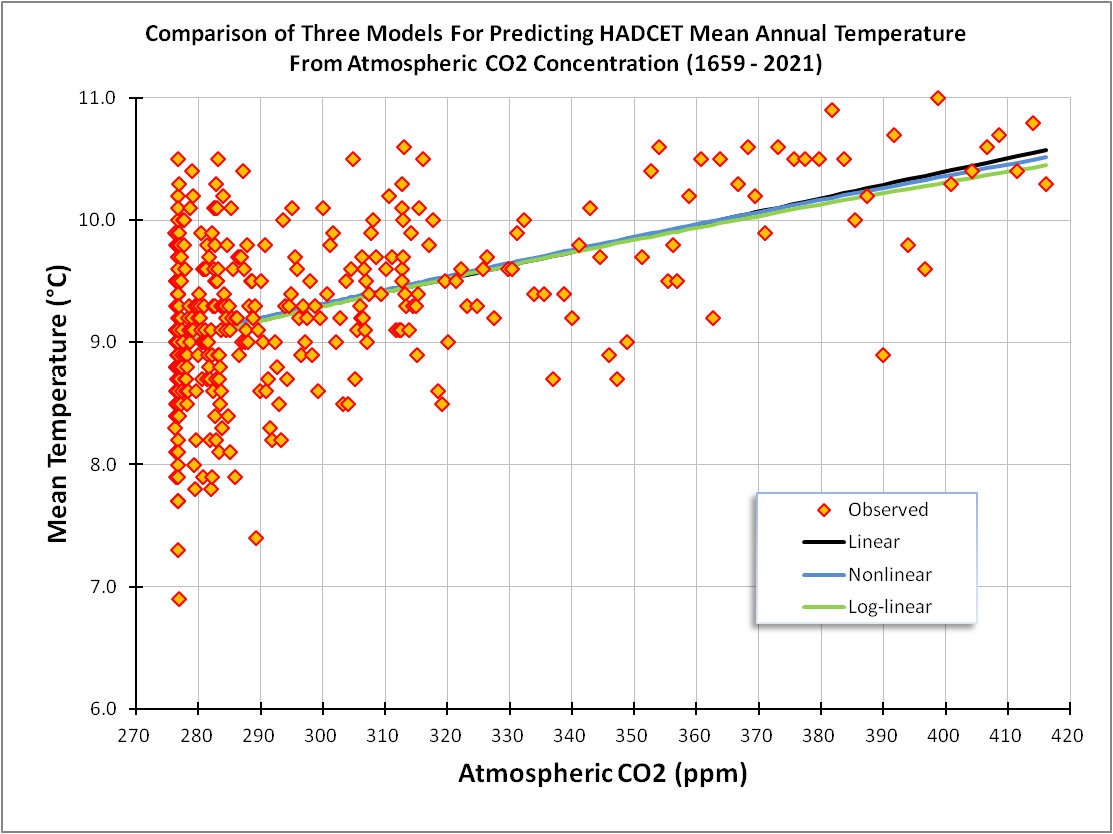
I am pretty sure that your first thoughts are going to be along the lines of… “well, there’s not much in it, innit, mate?”, and you’d be dead right for this narrow range of concentrations from 270 – 420ppm CO2. In the next article I’m going to reveal what happens when we zoom out to scary Mary concentrations of 0 – 500ppm, 0 – 1,000ppm and even 0 – 4,000ppm. Until then…
Kettle On!
What if you colour coded the 'observations' say at 50 year intervals to show a relationship with time.