Arctic Sea Ice (part 4)
A bracing analysis of the poster child of globalist alarmism: what you always wanted to know about Arctic sea ice but were afraid to ask
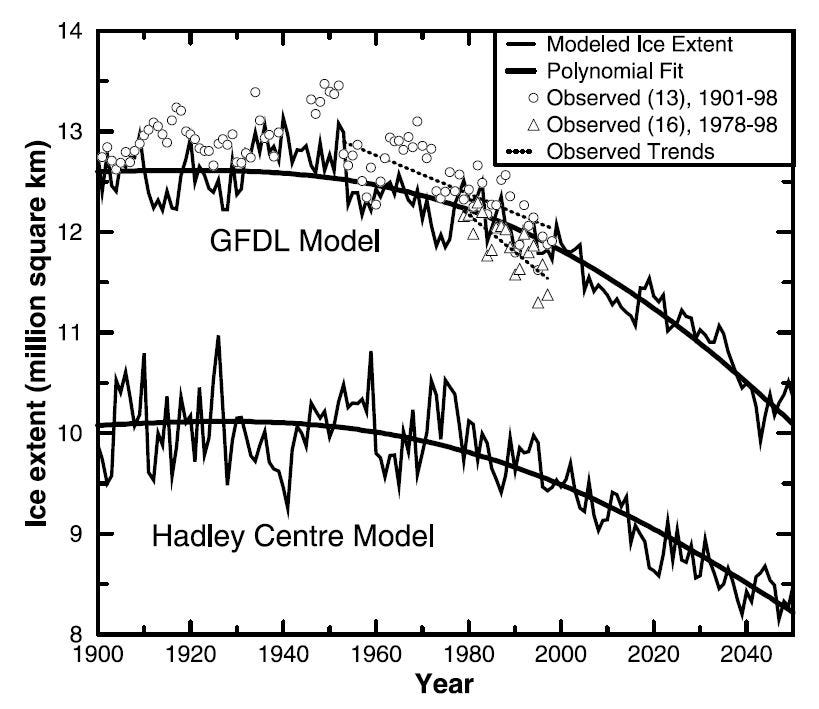
One more thing I want to do with NSDIC’s Sea Ice Index (SII) is to extend it back in time using pre-satellite era data. There is a splendid paper by the grand master of sea ice - Konstantin Y. Vinnikov – plus a few chums in the December 1999 edition of Science Magazine entitled Global Warming and Northern Hemisphere Sea Ice Extent, a copy of which may be found here. In it you’ll find this fabulous little slide showing observations of annual mean extent dating back to 1901, along with a couple of models:
I found a high resolution version of this vital slide sitting on servers at Rutgers University over in New Jersey, this august establishment being a leading academic hub for all things snow and ice.
IPCC AR1
This valuable data was utilised in the very first assessment report from the IPCC back in 1990. All that remains of that report online now is the main gubbins, with the technical papers and support materials lost somewhere in the aether. The policymaker summary of working group I (Scientific Assessment of Climate Change) for AR1 mentions Antarctica in section 9.0.2 and section 9.0.5 but Arctic sea ice doesn’t get a single mention! It’s worth having a look at what was said back then about Antarctica that got politicians in a tizzy fit:
9.0.2 The best estimate in each case is made up mainly of positive contributions from thermal expansion of the oceans and the melting of glaciers. Although, over the next 100 years, the effect of the Antarctic and Greenland ice sheets is expected to be small, they make a major contribution to the uncertainty in predictions.
9.0.5 The West Antarctic Ice Sheet is of special concern. A large portion of it, containing an amount of ice equivalent to about 5 m of global sea level, is grounded far below sea level. There have been suggestions that a sudden outflow of ice might result from global warming and raise sea level quickly and substantially. Recent studies have shown that individual ice streams are changing rapidly on a decade-to century timescale: however this is not necessarily related to climate change. Within the next century, it is not likely that there will be a major outflow of ice from West Antarctica due directly to global warming.
Arctic sea ice loss does get a brief mention in The policymaker summary of working group II (Potential Impacts of Climate Change) under section 5.0.20:
5.0.20 […] On the other hand, decreased sea ice could provide greater access to northern ports and even enable regular use of the Arctic Ocean for shipping. Moderate sea-level rise could also increase the allowable draught for ships using shallow channels.
Sneaking Around The Big Problem
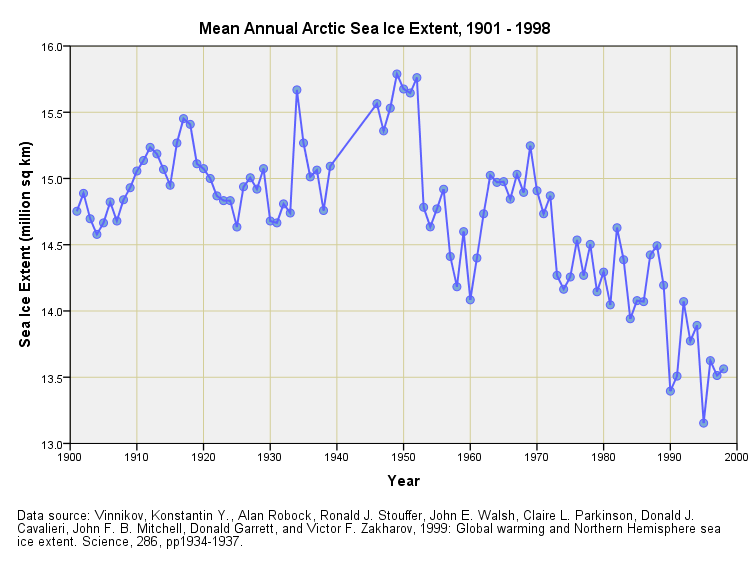
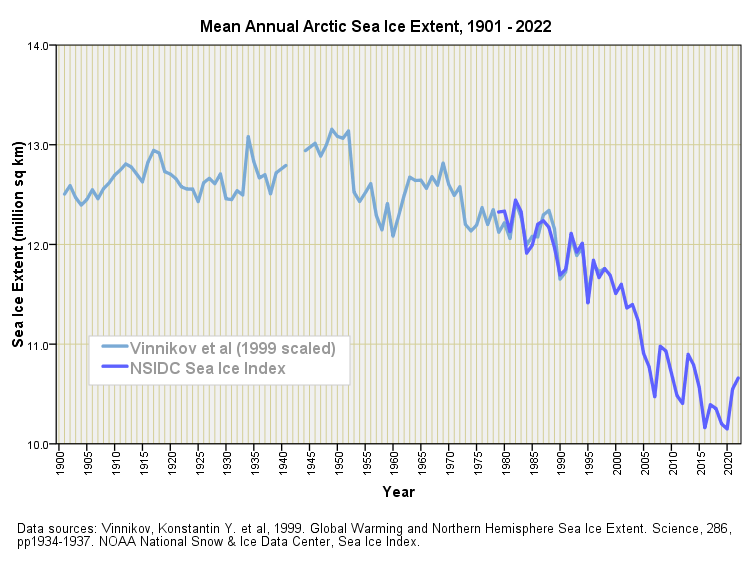
The big problem here for moi is not so much feeble policy waffle and a rarely-mentioned positive benefit of melting Arctic sea ice but having access to raw data from ancient publications. Thus, there is a sneaky trick I’ve developed in these circumstances using a vector graphics package (CorelDRAW) that enables me to take a decent raster image, overlay a vector layer, and conjure numerical values with a fair degree of precision, thus permitting statistical analysis that would otherwise be impossible. Admittedly, this takes a great deal of patience but the rewards are boon enough, the exercise also being a decent excuse to scoff a bucket load of biscuits. It is indeed a labour of love. Let us then have a look at my handy work…
Tada!
There are a few curious features within this plot starting with a modest build-up in mean annual sea ice from 1901 – 1952 that amounts to a positive trend estimated at an extra 0.13 million square kilometres per decade (p<0.001; OLSR). I don’t know about you but a build-up of ice as global industries started to explode and kick-out CO2 at a near exponential rate doesn’t sit easy with me if I am to don my foil hat of alarmism!
Then we’ve got that sudden plunge in mean ice extent from 1953 to 1960, which corresponds to some pretty cold post-war winters. Talk about the polar vortex dropping a clanger! If this dip was due to sudden and rather inexplicable polar warming arising from steadily mounting CO2 then how come things went into reverse gear from 1960 to 1969? All very odd indeed, and the sort of thing that requires coffee and cogitation, to which end I shall be digging out polar land and sea surface temperatures for the same period to see if these make sense of what we are seeing.
Dee’s Nature Trick
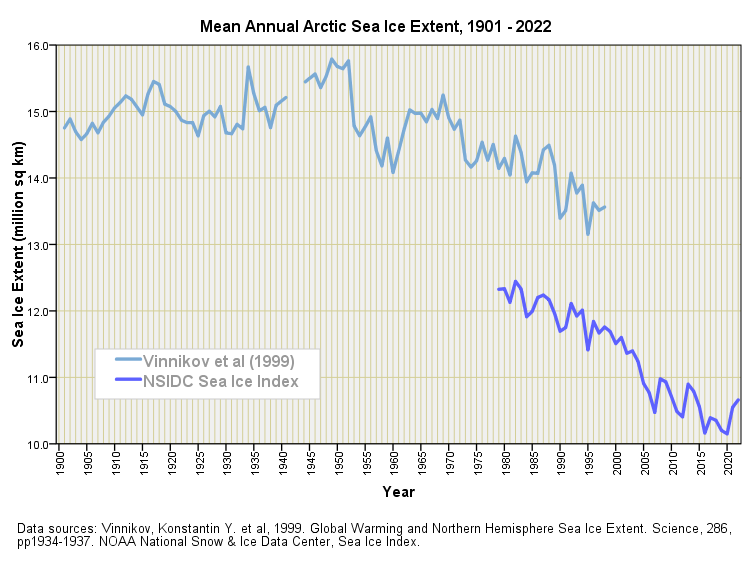
Michael Mann once did a “nature trick“ by (amongst other things) bolting modern temperature data on to the end of a mangled paleoclimatological time series to get his infamous hockey stick so I am going to do the same. I am going to bolt modern microwave satellite data on to the end of observations made using old-fashioned survey gear. Herewith the result:
Whoops-a-daisies!
Either NOAA seem to have lost a lot of sea ice or Vinnikov’s mob should have gone to Specsavers. My eyeballs suggest a consistent difference of 3 million square kilometres for it all depends on where you stick your theodolite, or where you sail your survey vessels, or where you point your satellite, or what you consider to be the Arctic.
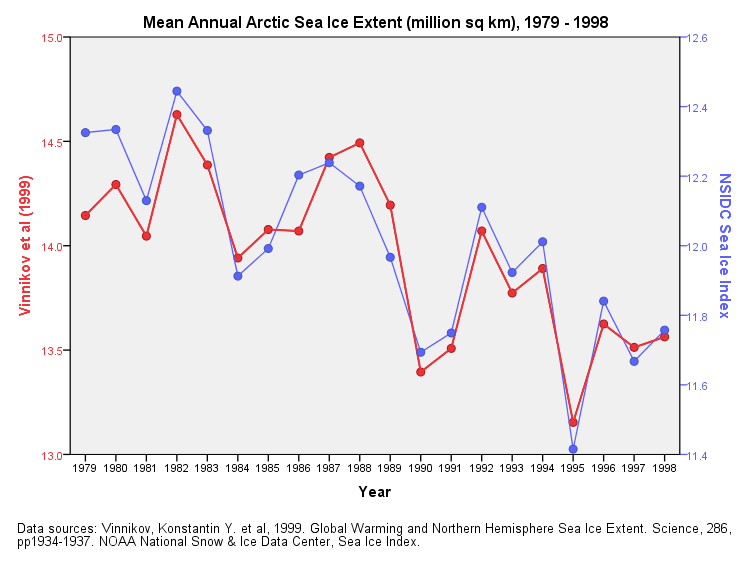
Differences are bound to happen and so I am going to develop a simple nature trick, starting with a dual axis plot of the overlap period of 1979 – 1998:
Isn’t that a cracker?! The close mirroring of these two series over this 20-year period (Pearson bivariate correlation r = 0.933, p<0.001, n=20) gives me confidence in forging ahead with a simple linear model for the adjustment of the earlier survey data so we may marry the two series together in perfect harmony. Herewith the fruits of that union:
I’m rather pleased with this, and shall put it to good use in the next article when I come to look at Arctic land surface and sea surface temperature records for the same period.
Meanwhile, that hole in the sock for the war years 1940 – 1945 needs to remain for the time being. Until then…
Kettle On!


Yes, digitize graphical data using basic drawing software... had to do it a number of times myself, T
tiresome but works. And for your data on sea ice AMAZING. How do you balance warming and COVID lives???
More fascinating stuff! It also occured to me that your name may well be a nom de plume, after John Dee the mathematician, astronomer, astrologer and occultist in Elizabeth 1st's time? If not your parents named you well!