
Antarctic Land Surface Temperature (part 4)
In this episode I take a closer look at the land surface temperature record of Orcadas base for the period 1903 – 2023 and reveal some hidden secrets

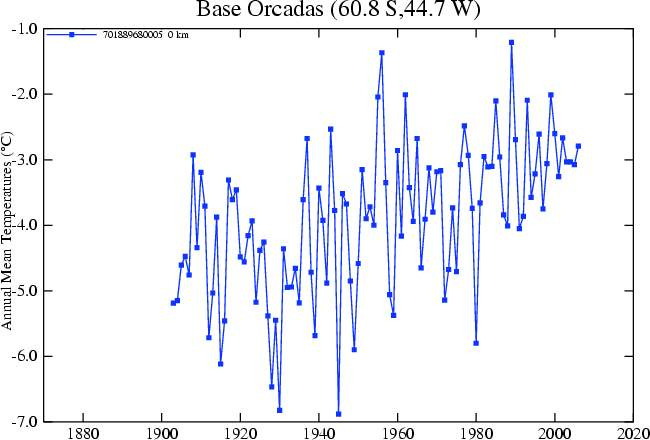
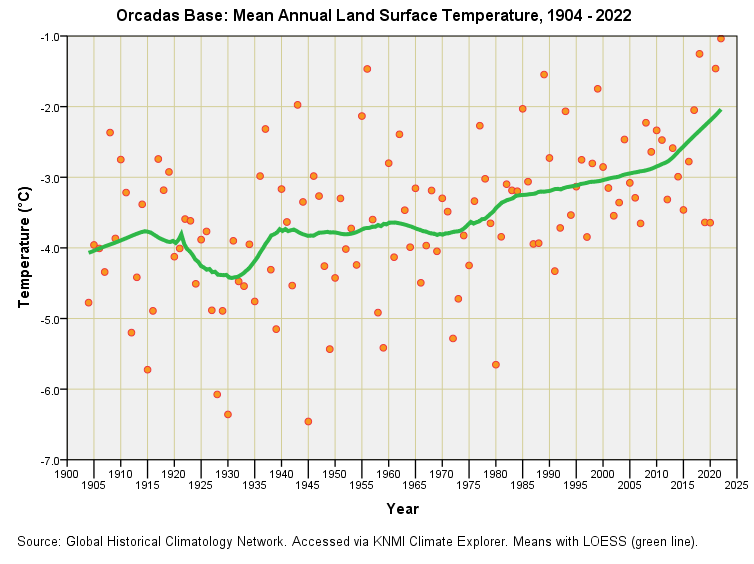
Right at the very end of part 3 of this series I produced the following screenshot of the annual mean temperature for Orcadas for 1903 – 2006:
If we grab a coffee we may pause for elevenses to ponder on the following questions:
How come this series goes back to 1903 when I previously showed data for Orcadas starting in 1957?
How come this series stops in December 2006?
How come an x-axis running from 1870 to 2020 is used to show data from 1903 to 2006?
How reliable are these annual means?
Now grab a slice of cake and consider these answers:
1. Because the GHCN-D daily dataset starts in 1957 but the GHCN-M monthly dataset for Orcadas starts in 1903. I had assumed that the two databases would yield equivalent data spans but this (mysteriously) is not the case and so I shall be digging out the monthly series for all stations for comparison. The problem with the monthly series is that we don’t know if a datum is just one measurement made on one day or an average derived from multiple measurements and, if the latter, whether just for a few days or every day that month. The graph above shows annuals means which compound this problem in that we don’t even know how many months were averaged each year to produce the series, let alone how many days within those months.
2. A good question because the GHCN-M data series for Orcadas stretches to July 2019, which suggests this aspect of the Wiki entry hasn’t been updated for at least 12 years - a most curious oversight if editors are trying to push the alarmist narrative. If you are suspecting they don’t want to reveal what has been happening since 2006 because it doesn’t support the alarmist narrative then you’ve come to the right place - I’m going to combine daily and monthly series to expand the series right up to April 2023.
3. This is the sort of visual trick you can play if you want to compress the series to exaggerate the warming trend. Anybody in their right mind would have used an axis running from 1900 to 2010 to plot data over the period 1903 – 2006 but, of course, these people are not in their right mind, they want to sell you a story.
4. Another good question. Scrutiny of daily data capture is the only way to get to the bottom of this so I shall be using both GHCN-D and GHCN-M datasets to get a handle on observation bias. Sometimes this doesn’t matter but when it comes to climate change you can bet good money that alarmists will take advantage if there is advantage to be had.
I hope you enjoyed your elevenses as much as I did, so let me brush the crumbs from my desk and start delving into the data…
Orcadas’ Little Secrets
The first thing to note is that Wiki’s little chart starts in 1903 with a mean annual temperature of -5.70°C (according to the GHCN-M record), which looks to be a little cooler than the chart would suggest. Either the data record has been subject to revision or somebody has decided to filter the data. In any case we have to reject 1903 out of hand because measurements started in April and not January. For the same reason we have to also boot out the incomplete current year, thus giving us the span 1904 – 2022 to play with.
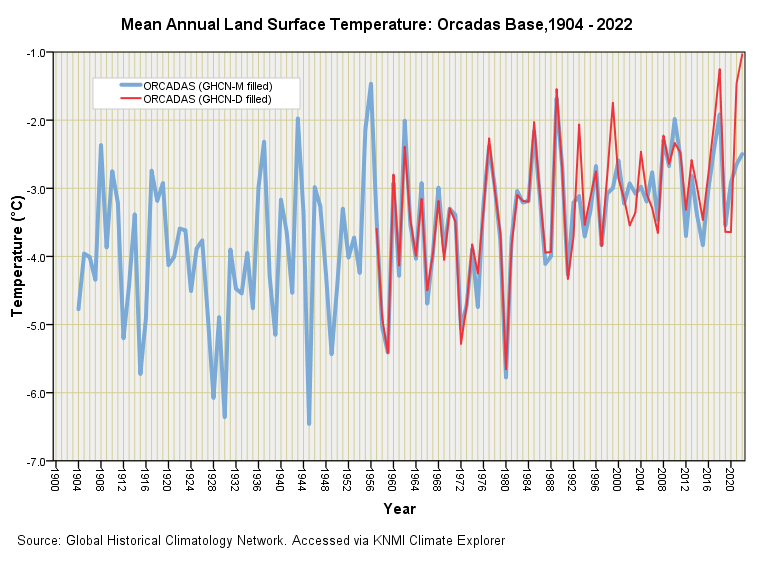
Let’s dive straight in with a dual time series plot derived from the raw GHCN-D and GHCN-M datasets:
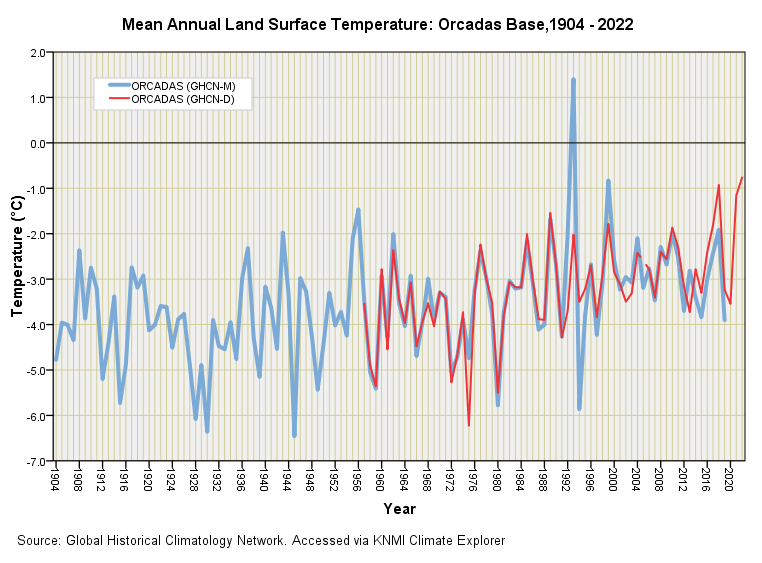
There is a generally excellent match, thank goodness, but with some curious exceptions. The monster record-breaking peak of +1.40°C for 1993 in the monthly record doesn’t appear in the daily record, which yields -2.02°C: a stonking great difference of 3.42 degrees. Wowser, that is some discrepancy! How is this possible? A darn good question because the daily series for 1993 returned no less than 364 daily observations so we can’t go blaming this on holes. Thus, for some obscure reason the monthly series is out of touch with daily reality so I decided to take a closer look. Here’s the reason:
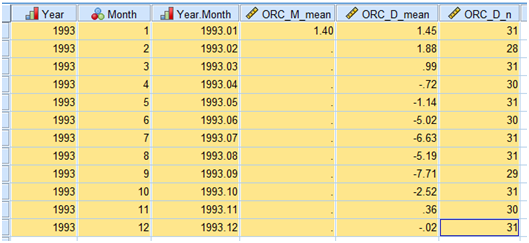
Despite there being 364 day’s worth of observations in the daily series (ORC_D_n) there’s only one observation in the monthly series and that is for January 1993 (ORC_M_mean), this being the hottest part of the Antarctic year. I suspect one of those frowns is in order! I hope readers have realised than annual means of anything we may measure climate-wise will be utterly worthless if we don’t collect data on a regular and consistent basis: the devil is always in the detail.
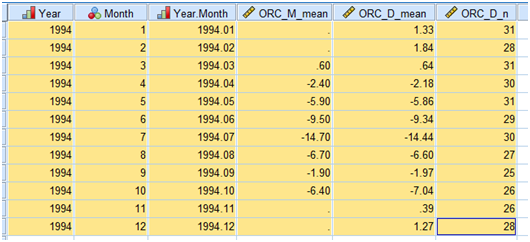
The same situation arises for the substantial discrepancy for 1994 with the monthly series offering -5.86°C and the daily series offering -3.50°C. This is down to missing monthly data as before:
So do we go ahead and trust the daily series in providing robust annual means from 1957 onward?
NO! Here’s why…
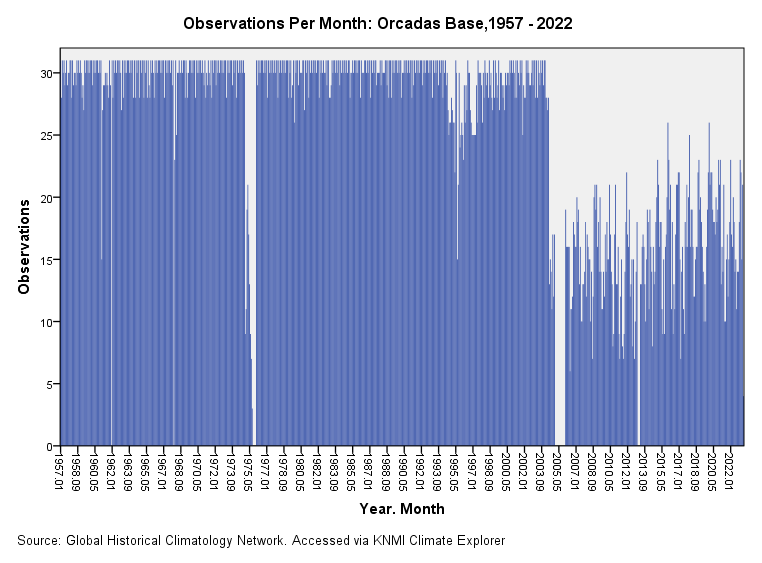
Right up until 2003 daily measurement at Orcadas was exemplary with 16,485 days recorded out of a total of 17,165 (96.0% data capture rate). Following a spell of absolute nothing during 2005 the base resumed recording temperature in 2006 at a rather impoverished rate of 3,157 daily records in 6,208 days (50.9% data capture). This extraordinary collapse in data capture means we cannot trust the land surface temperature record at Orcadas from 2005 onward to provide reliable estimates for the annual mean.
A great deal, of course, depends on whether the data loss was random or followed the changing weather patterns. What I can do to get a handle on this is plot out mean daily records per month for the whole year period January 2006 – December 2022 and see what we can see:
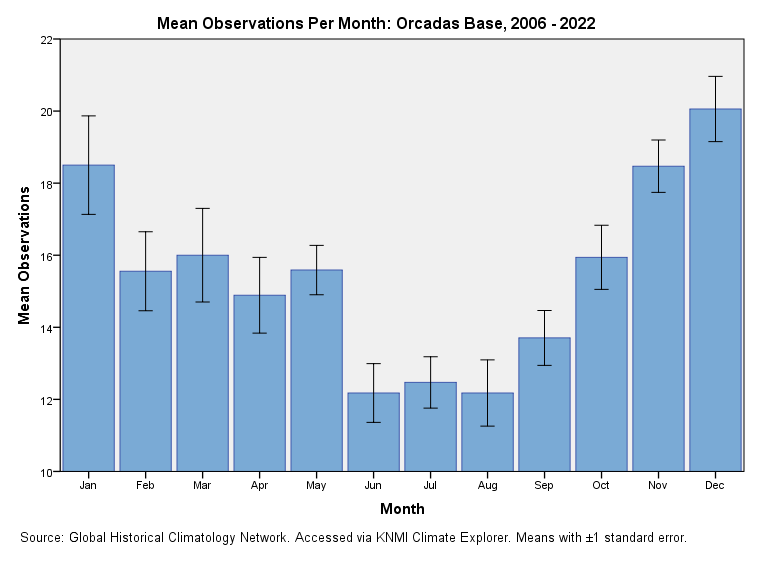
Well, well, well, no bias there, then!!! NOT (as they say). It should be pretty darn obvious from this that, since 2005, the crew at Orcadas have rather mysteriously found it increasingly difficult to record daily temperature and especially so during the coldest months of June, July and August. Either revisions to equipment and relocation of the temperature probe haven’t worked out or they’re cherry-picking data records like crazy. There also remains the utterly forbidden possibility that the colder weather is becoming more severe.
Whatever the reason the conclusion we must fry up in a knob of butter is that annual means at Orcadas since 2005 are biased in favour of measurements taken during the warmer months. Whoops-a-daisies!
Saving The Day
What we need to do to save the day is fill in all those holes from 2005 onward in order to eradicate the observation bias. This was done on the daily dataset using two infill techniques:
For missing values over six consecutive days or less linear interpolation was used;
For blocks of missing values over seven consecutive days or more the prior 5-year mean value was used.
Out of a total of 24,204 days between 1 January 1957 and 8 April 2023 the GHCN-D raw dataset offered 19,945 daily temperature records (82.4% data capture). Interpolation of sporadic missing values brought the daily records up to a total of 23,191 (95.8%), leaving prior 5-year means to fill out the remaining 1,013 missing values. These were largely poured into the years 1975 (only 100 raw records) and 2005 (no data whatsoever), with pretty equal splatter across the sorry-looking and rather shabby years of 2006 – 2022.
The GHCN-M dataset was also scrutinised for the full year period 1904 - 2022, with 1992 and 1993 seriously letting the series down with just one monthly measurement each. Ouch! Other dodgy years were 1994, 1995, 1999, 2004 and 2019, with just 7 or 8 monthly means on offer. Interpolation was considered risky so I opted for infill using 5-year prior means to plug the 82 missing values (94.3% data capture).
This fiddly-widdly work required a fair few pots of tea, though I was spurred on by the promise of home-made blueberry and almond muffins. The results are most satisfying (muffin- and data-wise) for I can now plot out annual means derived from both the infilled monthly series and infilled daily series for comparison.
I was hoping for a decent match after all that work primarily because this would validate my methodology. Take a look for yourselves:
That’s pretty good going IMCO1 with the daily series adding a little more refinement from 1992 onwards. What I can do at this stage is attempt to glue the two series together by taking the monthly-derived values from 1904 – 1956 and the daily-derived values from 1957 onward to produce my very best estimate of the warming trend at Orcadas. Try this for size:
There’s no doubt about a sustained warming trend but what is causing this is open to debate (at least it should be open to debate if we are being scientific about it). The dips are interesting as is the sudden acceleration from 2010 onward. If I stick one of those linear trendlines through this data cloud we obtain an overall warming rate of +1.40°C per century (p<0.001), which is very IPCC.
A Twist In The Tail
I thought we could leave this story there and go on to look at the relationship with surrounding sea surface temperature and sea ice extent but something dropped out of an idle fiddle that is worth mentioning.
I couldn’t resist running this cracking little tray bake through ARIMA time series modelling with all outlier detection algorithms blazing2. ARIMA informed me that only 1981 stands out as a peculiar year, this being the beginning of a local trend. To hammer the point home the ARIMA module displayed these fascinating results:
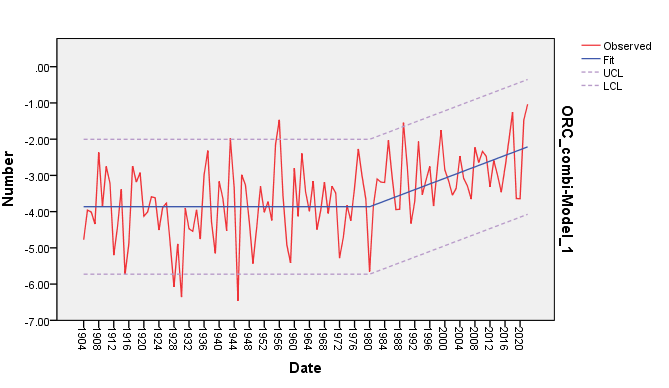
This raised my eyebrows a few inches, I can tell you! What ARIMA is telling us, in an objective manner, is that the mean annual land surface temperature at Orcadas remained constant over the 77-year period 1904 – 1980, at which point warming takes off like a rocket. How is this possible? Some questions:
Did they move or change the temperature probe?
Did they build something new and substantial close to the probe?
Are measurements now effectively suffering from the urban heat island effect?
Have currents in the surrounding ocean changed?
This sure doesn’t look like something gradual to me but appears to be a flip-point of sorts. Sure, it would be easy to point to atmospheric CO2 and mutter but that isn’t exactly doing science; following the science maybe, but following ain’t doing and understanding comes from doing.
In terms of linear regression we have a statistically insignificant warming trend of +0.04°C per century (p=0.400) for 1904 – 1980 and a statistically significant warming trend of +2.19°C per century (p=0.02) for 1981 – 2022 – talk about chalk and cheese!
We may conclude that Orcadas is schizophrenic in terms of land surface temperature, with not a jot of warming for the first 77 years of existence followed by a steaming two degrees per century thereafter. Clearly, a large piece of the jigsaw puzzle is missing so I guess I better take this well-groomed series and correlate it with sea surface temperature. Until then…
Kettle On!
In My Crumble Opinion - like humble opinion but with butter, sugar and flour rubbed together.
A description may be found in this article.
Interesting. I like these mysteries and I hope you do find out what changed around 1980 at Orcadas. I will try to do a bit more digging myself as I do like a bit of detective work. A cursory look threw up talk of an ozone hole which developed in 1980.
To be clear. I'm thinking that the clear linear trend would NOT support my site occupancy model... but it might.