
Antarctic Land Surface Temperature (part 3)
In this episode I derive mean annual temperature anomalies for the three main categories of base location and examine warming trends over time

Coastal Bases (0 – 20km from nearest coast)
In part 2 of this series we noted that the 29 bases in this location category fell into four distinct temperature profiles, the warmest of which is enjoyed by the 13 coastal stations of the peninsula. What I need to do now is to convert the raw temperature data for these stations into anomalies and boil these down into four grand mean anomalies.
Calculation of temperature anomalies requires declaration of a climate normal, being a common period when all stations were collecting the same thing at the same time. Typically this is a 30-year collection span that is common to all data sources. A span of 30-years is overly optimistic for the sporadic base record so I was aiming for something more conservative along the lines of a 5-year span. Incredibly, even this wasn’t to be, for there wasn’t a single year between 1954 and 2022 when all 13 stations managed to hit 50% daily data capture all at the same time. No climate normal means no temperature anomalies, which means no grand mean anomaly for coastal bases. Darn! We are thus left with the sorry option of looking at individual station raw data series, so here are those 13 stations once again:
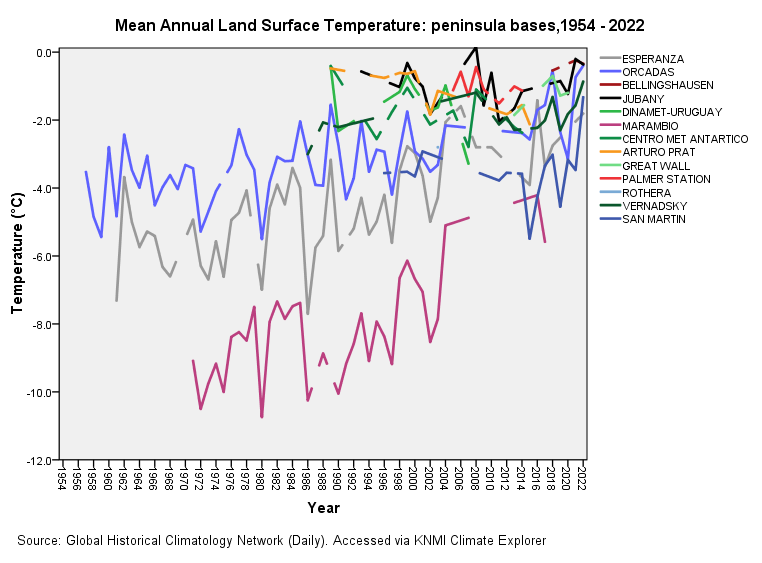
Our eyeballs indicate deffo warming trends at some bases, with my fave raver being Marambio (purple), but my brain also wants to know why there doesn’t appear to be any warming at Jubany (now known as Carlini Base). To assist with our cogitation I ran quick and dirty linear regressions for all 13 bases and tabulated some basic stats for the curves crayoned above. Grab a cuppa and feast on this:
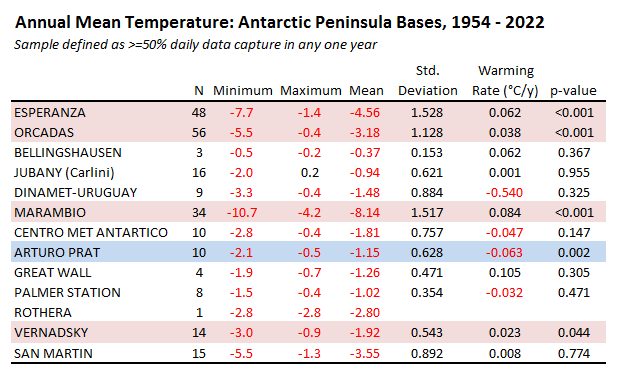
The sample here is restricted to those years where the daily capture rate met or exceeded 50% over the course of the year. Not great, I know, but it’s a start. Aside from the usual maxima, minima, mean and standard deviation of mean we’ve got the regression coefficients labelled as ‘Warming Rate (°C/y)’ along with the probability value associated with this. Taking 95% confidence as my yardstick I’ve coloured statistically significant warming trends in pink and cooling trends in powder blue.
We observe warming trends at 4 of the 13 bases, a cooling trend at 1 base and nothing much happening either way at 8 bases (though Bellingshausen and Rothera are lacking sufficient data points). If we consider the 4 warming bases alone we find a range of warming rates from 0.023°C per year to 0.084°C per year, this representing a factor difference of x3.65. How is it possible that some bases are warming nearly four times faster than others on the same peninsula? And how is it possible for a neighbouring base to simultaneously exhibit cooling with six other neighbours simultaneously showing no significant sign of change in the mean annual temperature?
I shall boldly suggest that these warming trends are nothing to do with climate change proper and everything to do with base development and siting of the temperature probe. The three warmest warming trends also happen to be found at the three largest bases (Esperanza, Orcadas and Marambio). Whoops-a-daisies!
Inland/Interior Bases (20 – 500km from nearest coast)
All three Queen Maud Land stations listed in part 2 of this series managed half-decent (‘half-decent’ as in 50% or better daily capture rate) data collection for the years 2010, 2014, 2018, 2019, 2020 and 2022, so this 6-year sample can be used as the basis for a rough and ready climate normal, from which I can derive mean annual land surface anomalies that can be merged into a grand mean anomaly for this location category. This is what this beastie looks like:
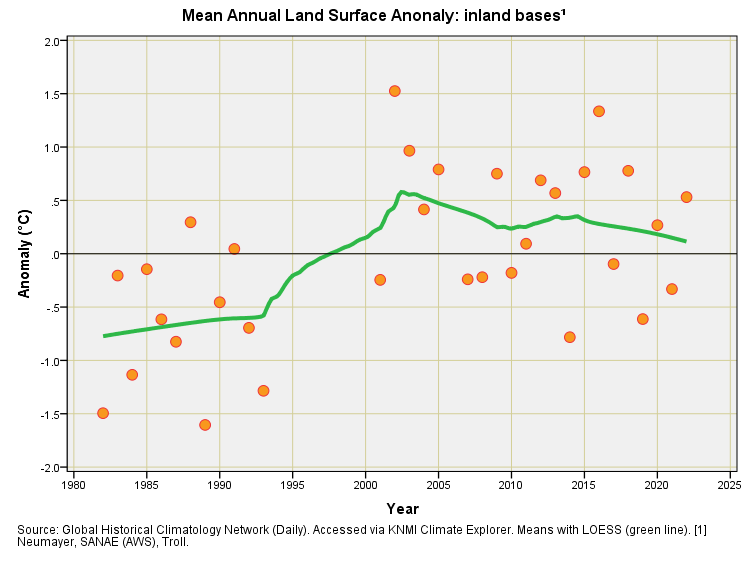
This is utterly fascinating and gives us our first clue as to what is genuinely going on down under, and away from the small town that is being developed at Esperanza. Basically we’ve got two data clouds separated by a great gap of unknowns, with the earlier cloud cooler than the first. Anyone trying to pin this on man-made climate change needs smacking around the head with a wet haddock because pretty much anything could have happened to cause this change. We should also note that the cooler and earlier cloud originates from Neumayer station alone, and it is entirely possible that the temperature probe was moved a fair distance given the base is now designated as Neumayer III.
If we stick to looking within data clouds, and focus on the more recent cloud that averages all three stations proper, then cooling of the continent would seem to be what is actually going on, which would make sense if the Arctic has been warming (the two poles play see-saw). So let me run some linear regression from 2000 onward and see what sort of cooling rate we are looking at…
It transpires we are looking at a cooling trend of -2.0°C per century that is statistically insignificant (p=0.356). My conclusion is that nothing much is changing when bases stay where they original were located and you get out of the townships, and get out of the big bases and on to the continental ice sheet ice proper. It also helps if you’re measuring the temperature within in the Antarctic circle – no less than 16 of the 56 bases under study lie outside of the Antarctic circle!
Deep Interior Bases (>1000km from nearest coast)
If we stick to our guns of accepting 50% or better daily capture rate during each year then the only time series we have to consider is that for the Amundsen-Scott base for the period 1957 – 1995. I’m pretty sure we used fossil fuels over this period so let’s run a scatterplot out and add one of those green wriggly LOESS snakes:
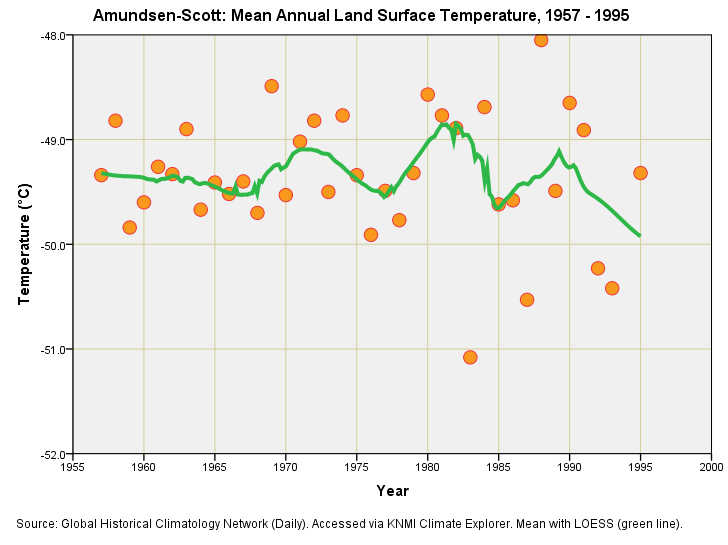
Before alarmists get too disappointed I will point out that linear regression yields a statistically insignificant cooling trend of -0.5°C per century (p=0.579). There’s nothing to see here, folks. We’ve got some wildness creeping in the later years but this could easily be due to observation bias arising from equipment failure.
But Wiki Shows Orcadas Has Been Warming Since 1903!
You bet it does. Down in the bottom right hand corner of this Wiki entry you’ll see this little chart that mysteriously stops in 2006:
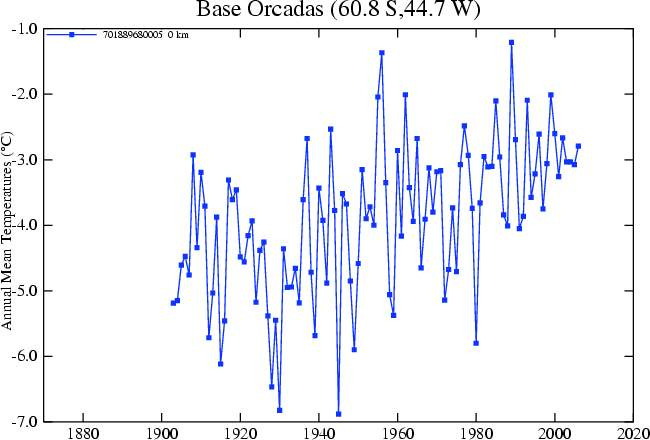
These annual means are derived from the GHCN-M database, being a monthly series rather than a detailed daily series and I shall be taking a closer look at this in the next article.
Kettle On!