
A Modest Cloud Cover Study (part 2)
Today I compare the CRU TS4.08 (0.50°), CLARA-A2 (0.25°) and ICOADS 3 (2°) cloud cover gridded datasets for the UK region

First a song; and a rather lovely one at that, as penned and sung by the great Joni Mitchell back in June of 1967…
Rows and floes of angel hair
And ice cream castles in the air
And feather canyons everywhere
I've looked at clouds that way
But now they only block the sun
They rain and snow on everyone
So many things I would have done
But clouds got in my way
I've looked at clouds from both sides now
From up and down, and still somehow
It's cloud illusions I recall
I really don't know clouds at all
… and here is some lovely footage of Joni at the 1970 Isle of Wight Festival, along with her fabulous Martin acoustic (tuned to DGDGBE I think). She’s been wonderfully imaginative with guitar tunings over the years, notching up no less than 50 during her career, with some sources quoting 80 if you include capo variants.
Today we humble Substackers are also going to look at clouds from both sides, those sides being the CRU TS4.08 cloud fraction 0.5° gridded assembly, and the CLARA-A2 cloud fraction 0.25° gridded assembly for the period January 1982 – June 2019 for the UK and inshore waters. We are talking state-of-the-art gear here, so there will be no excuse for weirdness.
Getting Stuck Straight In…
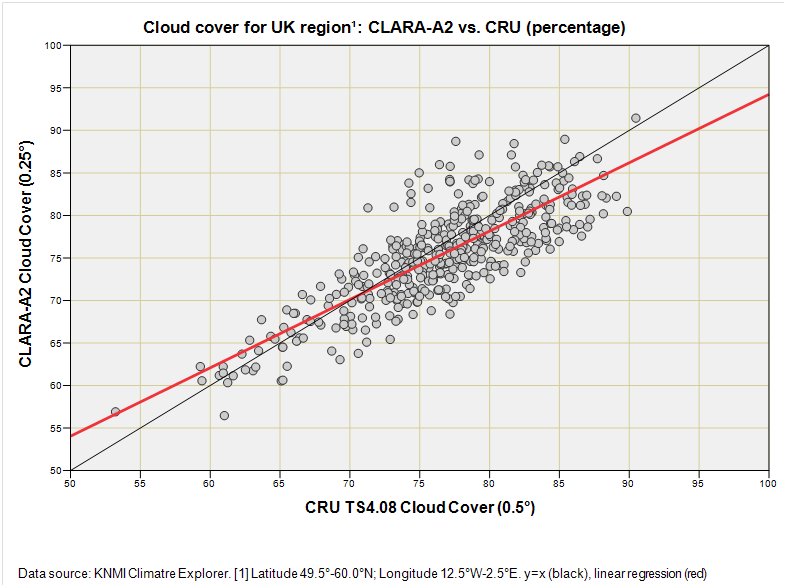
Now that’s a belter! This is precisely what I’d expect to see if two state-of-the-art datasets were offering up different estimates of the same thing over the same time frame. In Pearson terms we are looking at r = 0.812 (p<0.001, n=449). Nice one. The linear regression (red) has picked up something interesting in that it predicts a statistically significant intercept of 13.9% (p<0.001) for CLARA-A2 when CRU indicates zero cloud cover. This has the effect of twisting the fit a little such that the rate of increase for CLARA-A2 when regressed on the CRU data is not unity as we may expect but 0.80 (p<0.001). Whilst this is mildly curious, the BIG story here is that we’ve got two datasets in excellent agreement – phew!
So What About Okta?
Given that we’ve got excellent agreement between the CLARA-A2 and CRU TS4.08 cloud fraction datasets for the period January 1982 – June 2019 then it makes sense to restrict the ICOADS data to this range and see how those okta scores stack up. Let’s dive straight in again…
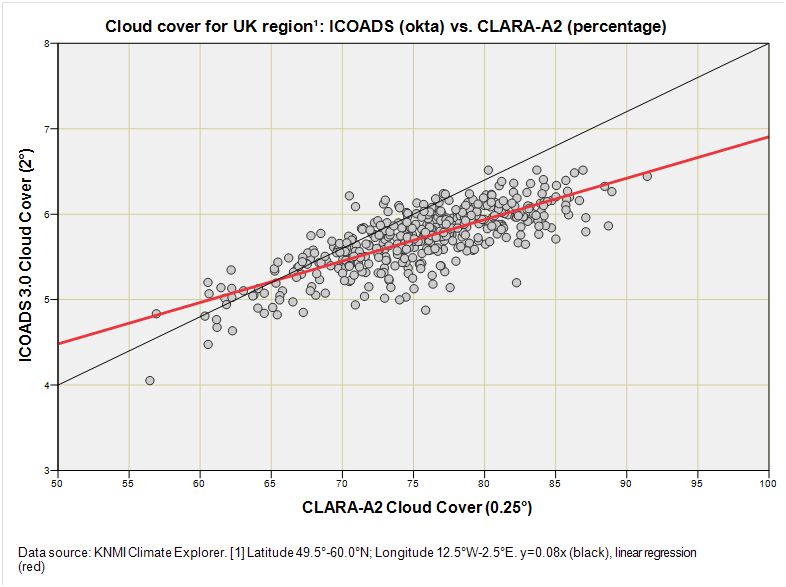
Well, well, well! We now observe good agreement, with the Pearson correlation coefficient fetching-up at r = 0.775 (p<0.001, n=449): a far cry from that first ICOADS vs. CRU scatterplot back in part 1. Equation-wise the linear regression yielded a statistically significant constant of 2.06 okta (p<0.001), which seems a lot to swallow given this suggests two eighths of the sky are covered according to ICOADS when CLARA-A2 satellite imagery indicates total clarity. H’mmm…
I’m now thinking about something bendy but it might be more complicated than that; there may be seasonal as well as historic biases to contend with. I guess it’s time to get the kettle on, get the crayons out and turn the handle on some time series plots to get a better feel for what is going on.
Monthly Time Series Plots
We shall start with the venerable ICOADS 3.0 2° gridded monthly aggregate cloud cover for the region of interest:
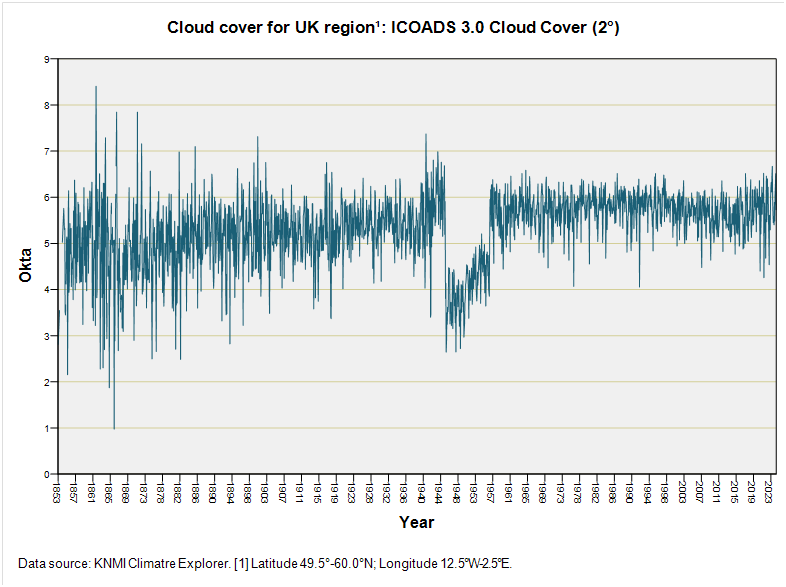
Holy Moly McTavish – what happened there?!! WWII went and happened, that’s what; and what is also WHAT! is that the data falls off a cliff during November of 1945. That’s not a climate event, I’ll wager, but a change in data collection. I’m guessing that the cloudier regions of the UK and Ireland were left to their own devices leaving only the sunny South in data collection mode. What a mess!
Setting that mess aside has anybody else spotted a touch of heteroscedasticity? Take a look at the monthly variation back in 1865, now take a look in the monthly variation in 2015 some 150 years later. It’s notably less, and that notably less means something has been changing slowly over time. Yes, it could be the weather; and yes, it could be long term climate change, but it could also be anything to do with data collection and reporting as well as data processing. But let us not forget that the science is settled!
In terms of medals, then gold for cloud cover goes to February of 1862 with an ‘impossible’ mean of 8.41 okta. Assuming this was thwarted by inclusion of occluded sky scores of 9 then the first sensible mean that crops up is 7.85 okta for January 1867 and January 1872. Bronze goes to March 1941, with a score of 7.37 okta. The twenty-first century doesn’t get a look in until the twenty-first place, with March 2024 yielding a mean of 6.67 okta. In terms of medals for blue skies then gold goes to June 1866 with a mean score of 0.97 okta, silver goes to April 1865 with a mean score of 1.87, and bronze goes to April 1855 with a mean score of 2.00 okta. The twenty-first century doesn’t get a look in until 203rd place, with March 2022 yielding a mean of 4.26 okta. If we play the Met Office game we may conclude it was cloudier way back, and yet it was also sunnier way back; and we simply used to call it “British weather”.
Assuming everybody involved got their act together by 1960 then my eyeballs don’t detect anything much happening, though there appears to be a subtle decline in cloud cover up to around 2015 when things started to gently ramp up. I’ll be looking at this in a moment or two, but for now let’s go straight in with the CRU TS4.08 0.5° gridded cloud cover dataset for the same region:
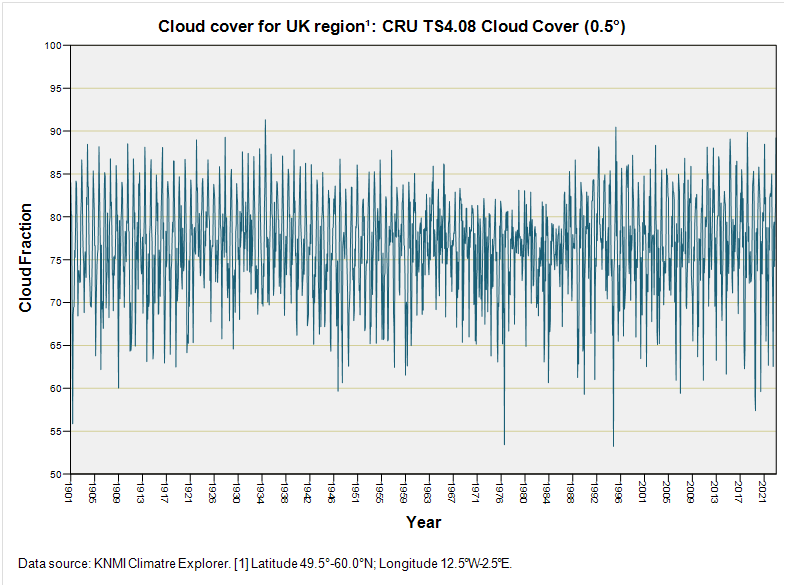
There’s no mess back in 1945 thank goodness, which tells me the CRU mob has diligently dug up some decent historic records (or made values up again). No sign of heteroscedasticity for the main part, but there is that slight decline still, this time leading up to 1960 (and a bit of a heterowotsit pinch point). H’mmm... is that the climate doing things or is it another of those data processing quirks? Rest assured that the science is settled!
In terms of medals, then gold for cloud cover goes to December of 1934 with a mean of 91.33%. Silver goes to January 1996 with a mean of 90.47%, and bronze goes to December 2018, with a mean of 89.86%. Quite a different bag of results! In terms of blue skies we have August 1995 bagging the gold with 53.22%, August 1976 bagging the silver with 53.42%, and May 1901 bagging the bronze with 55.86%. Again, a different dollop of results depending on which dataset you fancy.
While we are humming and grunting we might as well consider the flashy new dataset that is the CLARA-A2 0.25° gridded cloud cover time series:
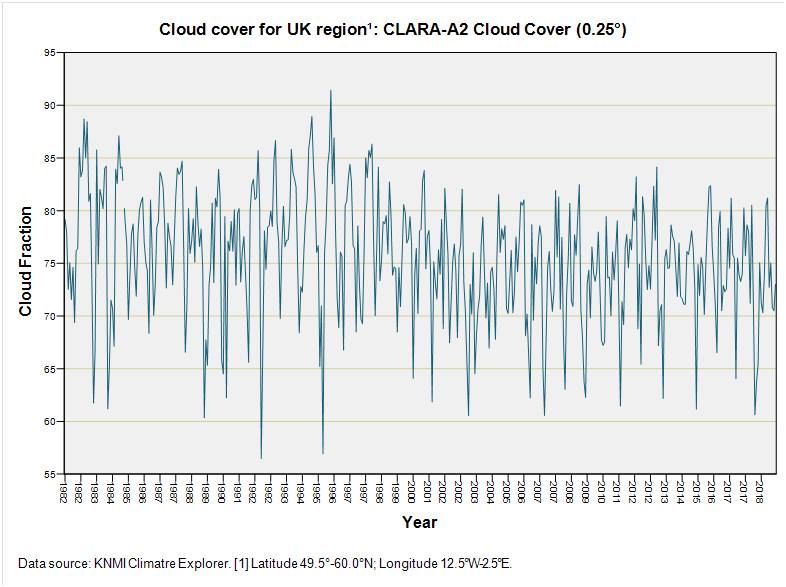
A decline by Jove! But not the same decline as the CRU TS4.08 time series, and not the same decline as the ICOADS 3.0 time series.
In terms of medals, then gold for cloud cover for this pathetically small time frame goes to January 1996 with a mean of 91.44%. Silver goes to January 1995 with a mean of 88.95%, and bronze goes to January 1983, with a mean of 88.71%. In terms of blue skies we have May 1992 bagging the gold with 56.46%, August 1995 bagging the silver with 56.91%, and May 1989 bagging the bronze with 60.33%.
While we’ve got all three balls in the air I shall restrict the period to January 1982 – June 2019 and run out a quick correlation matrix:
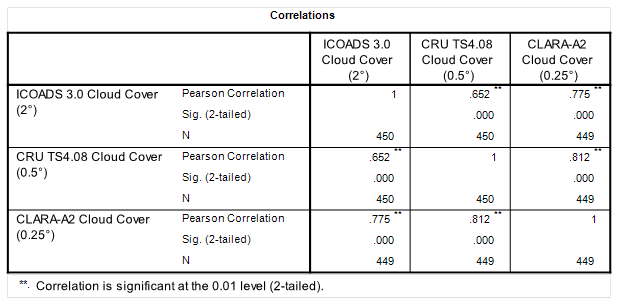
OK, so that’s interesting. The winning pair turns out to be CLARA and CRU, with r = 0.812 (p<0.001, n=449), with CLARA and ICOADS picking up the silver medal with r = 0.775 (p<0.001, n = 449). In the bronze position we have ICOADS and CRU with r = 0.652 (p<0.001, n=449).
Coffee & Cogitation
I’ve come to the end of the email limit once again, so once again we need to draw up a stool and sit quietly for a few moments. These differences between the datasets studied do not surprise me one jot and, in fact, it’s what I’d expect along with whoopsies – both big and small - in data collection and processing. This is not so with the gridded temperature datasets from the big players, for these are always in complete magical agreement. Funny that.
But what next?
Well, the CRU dataset looks promising and is reasonably up to date, so I’m inclined to rely on this, especially in light of the excellent agreement with the latest, hottest CLARA-A2 satellite observations. By choosing CRU I can also do a bit of corrective modelling of the wonky WWII ICOADS okta values, thereby extending observations back to 1853.
Another tranche of work I’ve got planned is to look at seasonality, and to explore changing seasonality over time (if it indeed does change). Then there’s the big ARIMA spanner to wield to see what we may see. There’s plenty to come so get those cookies baking!
Kettle On!
I guess this all relates to albedo? I remember Vangelis had an album out in the 70's called "Albedo 0.39". Apparently overall albedo has dropped quite a lot since then. Have you seen this ? https://notalotofpeopleknowthat.wordpress.com/2025/05/18/reduced-cloud-cover-global-warming/
As usual wow!! I must talk to my brother, who used to fly in Snoopy up in the clouds before the Met Office moved to Devon.