
A Modest Cloud Cover Study (part 1)
I analyse not one, not two, but three datasets to get a feel for what clouds have been doing over the UK

I’ve got some tasteful Venetian blinds here at the window in my bedroom office in a pale ivory colour that matches the creamy walls. The reason I have them, and the reason I use them, is to control how much sunlight enters the room. A simple matter really, and normal folk with normal brains and normal mindsets will be going about their business this summer with blinds and curtains at the ready for when we get a spectacular glimpse of the sun. I particularly like those gigantic cardboard sunglasses you can place across your car windscreen largely because I find the tasteless rather tasty!
But the same level of normality doesn’t apply to climatologistas, and climate modellers in particular. Clouds schmouds and harrumph to all that drivel! Clouds are a symptom of climate change and not a driver is their chestnut. Well, not only would they say that but they’re paid cash money to say that, so their biased line of reasoning doesn’t get us anywhere.
Back When
I remember coming across the work of Dr Henrik Svensmark back in 2015. It’s a vivid memory because I’d just got to grips with Facebook and made the rookie mistake of talking to alarmists about Milankovitch cycles. One outraged woman declared that it was people like me who were going to be responsible for the death of her babies. And then a most peculiar fellow insisted that carbon dioxide was deadly poisonous and that all of it should be removed from the atmosphere. I was wondering what the absolute fudge I’d wandered into when some kind chap (who wasn’t shouting) suggested I take a look at the work of Svensmark. And so I did, and I confess to getting very excited indeed. It’s beautiful work, and those interested might like to spend 52 minutes with cuppa in hand watching this summary documentary.
You Want More?!
But there’s more to clouds than cosmic rays – a lot more. Those with time and inclination might like to plough through umpteen articles on the subject over at WUWT by clicking on this simple search tag. Those who prefer the illusory safety of formal papers might want to cogitate with coffee over Radiation Transport in Clouds by W. A. van Wijngaarden & W. Happer (2024), which was published back in December. Here’s the abstract:
We briefly review the dominant role of clouds in Earth’s climate. The earliest observational studies of heat transfer through Earth’s atmosphere, for example, those of John Leslie around 1800, showed that clouds have a large effect on radiative heat transfer from Earth’s surface to space. Greenhouse gases also affect heat transfer, but much less than clouds. For example, “instantaneously doubling” CO2 concentrations, a 100% increase, only decreases radiation to space by about 1%. To increase solar heating of the Earth by a few percent, low cloud cover only needs to decrease by a few percent. The first half of this paper reviews observational facts about how clouds affect heat transfer. The second half gives a brief summary of the new 2n-stream radiation transfer theory for quantitatively analysing how clouds scatter radiation incident from outside the cloud, and how they emit thermal radiation generated by their particulates.
Eric Worrall, writing for WUWT, also hit the nail on the head when he asked Did Fewer Clouds Contribute to This Year’s Global Warming? back in early December.
Buzz Aspirin
ALBEDO is the buzz word here and we have NASA lead scientists such as Gavin Schmidt saying things like, “we still aren’t able to say why the albedo has been changing so much.” There’s a headache right there. It doesn’t take much thought process to realise that Earth’s albedo is directly related to cloud cover; and I’m sure that Gavin realises this, but it’s also obvious that he’s going to be placed in an awkward position when accosted by eco-journalists. Not just cloud cover neither, but snow and ice cover play their part in the albedo equation and I’ll be looking at this in a future series.
With all this up in the air (if you’ll excuse the expression), it occurred to me that I haven’t looked at cloud cover data in any shape or form (I seem to recall). My spanners have not been applied to any cloud cover datasets even though I’ve wittered on about things likely being due to cloud cover. In this series I hope to remedy this.
But Where To Start?
But where to start? (he said again) The world is a big place, and it is a complex place, so I fancied starting out nice and simple by studying a very small piece of it. The UK to be precise, because that’s where I’ve been chewing on wind, rain, storms, sunshine, land temperature and all that. It’s also where I live, so I’ve got a fair few years of experience of the weather here… and I’ve a book on clouds.
Here’s my definition of the UK…
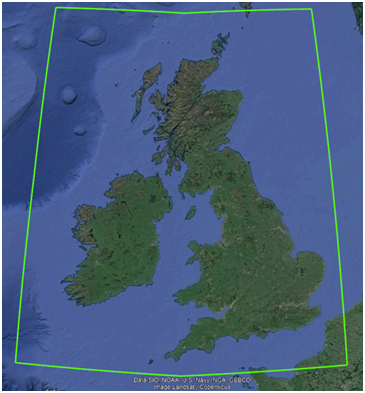
What I want now are well-seasoned gridded products from the big players that provide data for this region going back at least 60 years, and ideally daily data for the last 100+ years. If we forget the grail that is daily data it just so happens we can get satellite-based monthly data going back to 1982 from the bods at EUMETSAT. We can also get mixed source monthly data going back to 1901 from the bods at CRU; and we can get mixed source monthly data going way back to 1853 from the bods at ICOADS. And, to make it all smashingly fabtastic, we can access these three datasets via KNMI Climate Explorer.
Whilst I’m wary of any and all gridded products fried-up by the big players there’s no other sensible option open to me as things stand. I’m not in a position to pull down millions of data records from umpteen observatories and spend weeks crunching the data to perfection, so takeaway food of dubious provenance bumped-up by a pile of buttered bread is what I’m going to slap on the table. We shall munch away cautiously!
With caution in mind let’s take a quick squizz at data quality…
Data Quality
ICOADS 3.0 Cloud Cover (2°)
If you want a copy of this dataset for yourself then please launch KNMI Climate Explorer and go fill out the necessary parameters. For the region under study gridded data with a resolution of 2° were available for the period January 1853 – February 2025, there being 2,066 available monthly records with just 26 missing values (98.7% completion rate). This is good going, so let me furnish a table of summary statistics and a drab histogram:
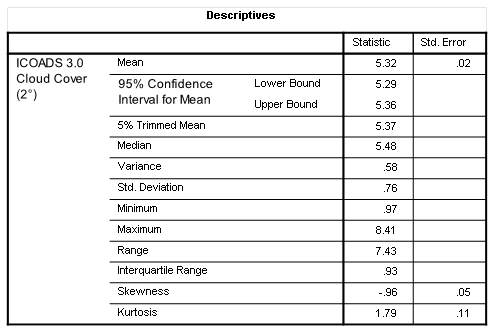
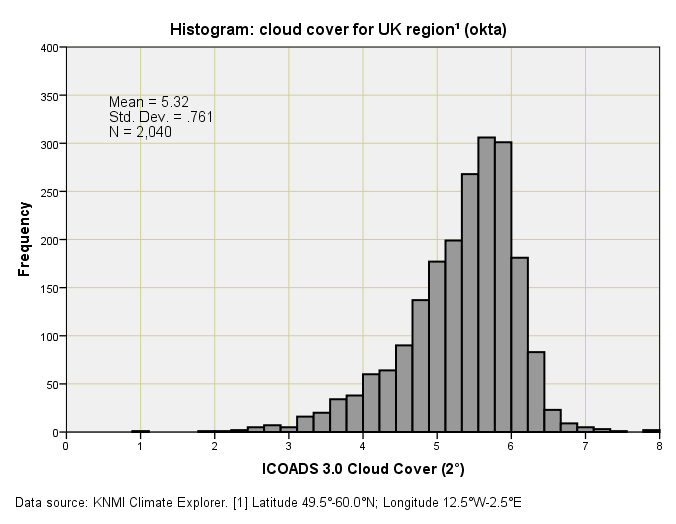
The first thing we need to realise is that this dataset isn’t in the units we’d expect (percentage or proportion of cloud cover). The unit here is, in fact, the Okta, which is an index scale based on an estimation of how many eighths of the sky are covered in cloud. This scale ranges from 0 oktas (completely clear sky) through to 8 oktas (completely overcast). Later on there will be fun and games as I try to equate the ICOADS historic okta data with the CRU historic cloud fraction data, but for now let us take things as they are and cogitate on what we’ve just seen.
I guess we ought to start with the overall series mean of 5.32 oktas which, to my crude reckoning, should represent 66.5% cloud coverage. I can buy that. We then have a minimum of 0.97 oktas (12.1% cover), and I can buy that because we’re looking at a monthly aggregate for the entire UK. However, I can’t buy the 8.41 okta maximum given the scale is supposed to end with a score of 8. Yes, there is indeed a score of 9 but that’s reserved for days when the sky is occluded by dense fog or heavy snow. Heavy snow will mean a ton of clouds but this is not necessarily the case for low-lying blankets of fog. It’s never bleedin’ straightforward is it?
There were no strange and wonderful outliers according to my ogling of the boxplot (not shown) but the histogram exhibits a great deal of negative skew (leaning toward the right). What this means in the real world is that there was a preponderance of months with lingering partial cloud cover over the 173-year period. Yep, I can buy that.
CRU TS4.08 Cloud Cover (0.5°)
If you want a copy of this dataset for yourself then please launch KNMI Climate Explorer and once again go fill out the necessary parameters. For the region under study gridded data with a resolution of 0.5° were available for the period January 1901 – December 2023, there being 1,476 available monthly records with 0 missing values – yes zero! - (100.0% completion rate, according to my fingers). This is exceptional going1, so let me furnish another table of summary statistics and another drab histogram:
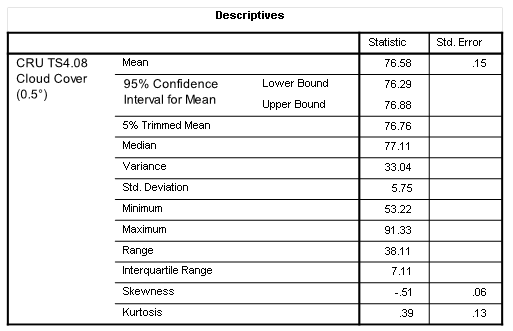
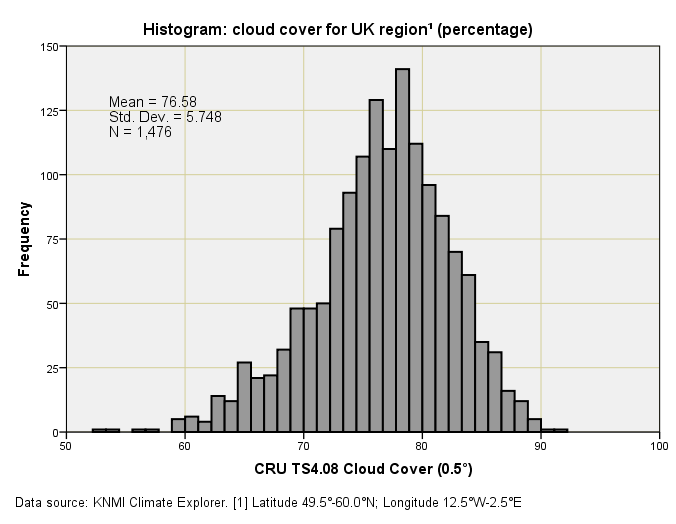
The first thing we need to realise is that this dataset is in the units we’d expect (percentage of cloud cover a.k.a. cloud fraction). Yaroo and buns all round! If we kick-off with the mean of 76.58% - a reasonable figure for these islands - then we immediately spot an issue: 76.58% is a whole lot more cloud than the ICOADS 59.1% estimate. I can see that I’m going to have to wield the spanners to get to the bottom of this for both the ICOADS and CRU backroom bods must have been using exactly the same paper records for much of the historic period. H’mmm…
But let us put this wrinkle aside and consider the minimum of 53.3% cover and maximum of 91.33% cover. That minimum feels a little high to my way of thinking, even when taking the aggregate issue (both time and space) into cogitative account. Then again there is Scotland: I don’t ever remember a clear day up there.
This time round there is far less negative skew, and the gamma-like shape appeals to my sense of spannering. Nice one!
CLARA-A2 Cloud Cover (0.25°)
If you want a copy of this dataset for yourself then please launch KNMI Climate Explorer and go do what needs to be done. For the region under study gridded data with a resolution of 0.25° were available for the period January 1982 – June 2019, there being 450 available monthly records with just a single missing value (99.8% completion rate). This is crackingly good going but, alas, a tad short on the timescale, so let me furnish a table of summary statistics and a drab histogram:
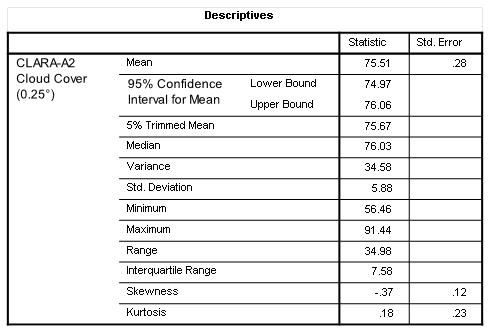
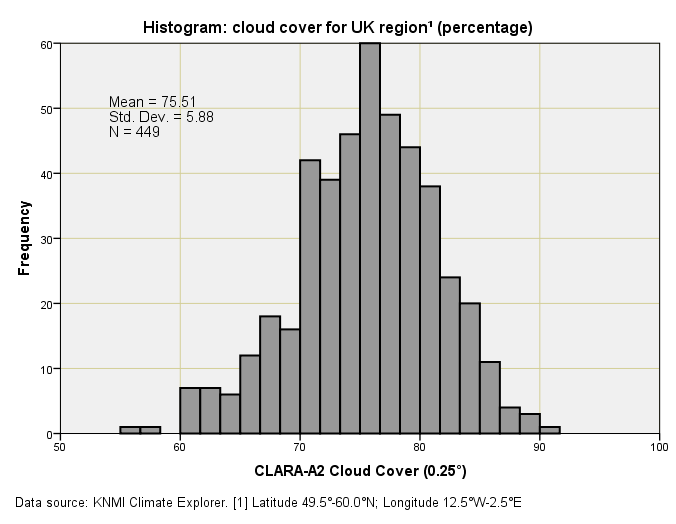
Again the dataset is in the units we’d expect, and the overall series mean of 75.51% isn’t that far away from the CRU TS4.08 mean of 76.58%. Looks promising! I’m still bothered by the minimum monthly cloud cover estimate of 53.22% but we’ll have to wait until I get truly stuck in to see if this is reasonable.
Understanding Okta
The feeling in my bones is to start out by converting the ICOADS okta values into percentage of cloud cover if that is at all possible. If it’s not then I’ll have to paddle down a different river. Fortunately the ICOADS okta series overlaps with the CRU percentage series over the period January 1901 – December 2023, so I shall do something quick and simple and thrash out a Pearson regression that fetches-up at r = 0.430 (p<0.001, n=1,476). That’s not a lot and I was hoping for correlations in the region of r = 0.80 to r = 0.90 range. This tells us that the ICOADS okta-based observations are not necessarily a straightforward proxy for CRU cloud fraction. Bother!
I guess we better take a look at the scatterplot:
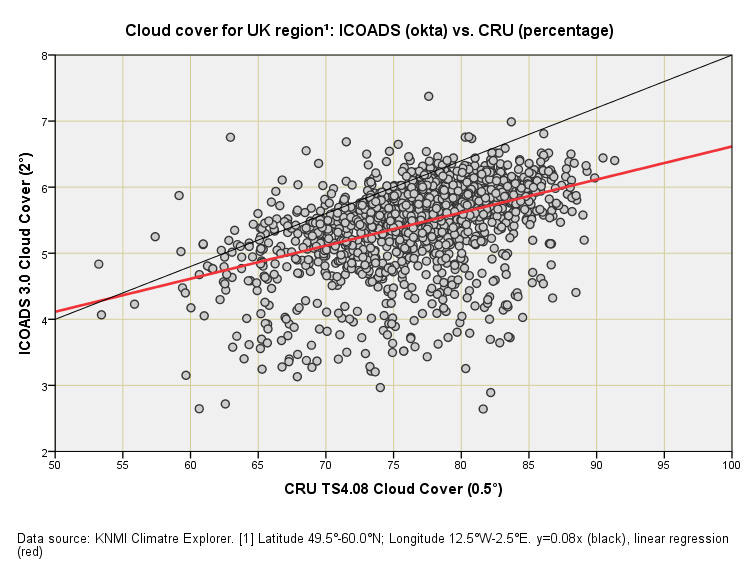
On this plot I’ve plonked two lines: 1). The function y = 0.08x in black representing a theoretical relationship based on each eighth representing a 12.5% cloud fraction; 2). A linear regression trendline in red, details of which we’ll get to in a moment.
If all was simple in the land of okta then an ICOADS mean score of 4.0 would represent 50% CRU cloud cover; and a mean ICOADS score of 8.0 would represent 100% CRU cloud cover. The data points would then randomly fall about that black line and we could relax in the knowledge that one scale is merely an expression of the other. But that ain’t the case, with the data points falling around the red trendline, the equation for which is: y = 1.613 + 0.05x (p<0.001).
Translated into reasonably plain English this means the ICOADS okta series kicks off with a score bias of +1.6 (instead of zero), and then runs rather cool at only 0.05 okta points per degree of cloud fraction instead of the theoretical 0.08. This feels a bit ‘off’ to me, and then there’s that enormous scatter to consider: how is it possible to have a CRU cloud fraction of 80 - 85% and an ICOADS okta score down at 2 – 3? We are, after all, talking about the same basic chunk of sea, land and sky despite grid resolution differences.
What gives?
Coffee & Cogitation
There was me thinking it would be a simple matter to stitch a couple of cloud cover data sets together and get on with the business of time series analysis, and here we are once again wondering what on earth the big players have been up to in the data department. What I better do next is compare the more recent CRU and CLARA data to see if they agree – I sure hope they do!
Kettle On!
Unless they’ve made the data up once again - remember climategate!
In 1987/88 I spent 12 months at the Polish polar station in Hornsund on Spitsbergen. My field was magnetic field measurements, but I sometimes replaced meteorological colleagues when they went on excursions. At that time, the Okta was used, so I looked into it a bit.
From my observations, the mysterious phenomenon of the lack of agreement between the Okta and percentages probably results from the method of measurement. The Okta was estimated by a human. The percentages, on the other hand, are machine-based.
Sometimes a simple projection system was used to estimate cloud cover by humans, but often they simply observed directly in the sky by eye. And here lies the "hund begraben". Humans perceive objects near the horizon differently than at the zenith, for example the well-known apparent change in the diameter of the moon and the sun's disk.
There are probably a few more sources of human error.
There is most likely no better method of mutual calibration of both methods than the one you used.
I love it when somebody puts flesh on the numerical bones - thank you! I continue exploring this relationship in parts 2 and 3.