A Century Of UK/NI Rainfall (part 5)
A butcher's at drought and deluge over the last 100 years. Are things getting worse, and what does ‘worse’ even mean?
In part 4 of this series I promised to check NOAA’s data records for the venerable observatory at Oxford. After a somewhat sobering Turkish coffee of some strength and a plate of freshly plucked figs I decided, in my sugar-laden hyper-state, to abandon NOAA’s miserable attempts and look at the UK Met Office’s records for the UK. That sure made more sense!
The prospect of pulling down records one year at a time for one station at a time from the MIDAS database then building a comprehensive time series for UK rainfall didn’t seem like much fun so I decided to rely on what may be squeezed from the Met’s Historic Station Data mini-series, which may be found here. In a jiffy I was sitting on monthly records for 37 stations dating back to 1853 (Armagh and Oxford).
Holes In Buckets
The first checkpoint was to consider whether stations had diligently collected data for their entire span of operation of whether some had holes in their buckets. I am rather pleased to report that 28 of the 37 stations possessed complete data records, with Ringway leading the bad bucket pack at 40% missing rainfall records. This station opened in 1946 but only started collecting rainfall data in 1961, with the last attempt made during October of 2004 when the station was closed. That’s a bit too leaky for my liking and so the station was excluded from analyses along with records for Cwmystwyth (closed 2011) and Southampton (closed 2000).
The last station to come online with its bucket was Ballypatrick Forest in Nov 1988, despite this opening in 1961; hence 1989 is the first full year where we may observe all of the remaining 34 stations doing their thing right up until Jul 2022. The range 1989-2021 will be a useful full-year comparative period for certain analyses but at some point I will extend the study period all the way back to 1900 since when 5 long series stations (Armagh, Oxford, Stornoway Airport, Durham and Sheffield) have been doing their thing.
Wet ‘n’ Dry
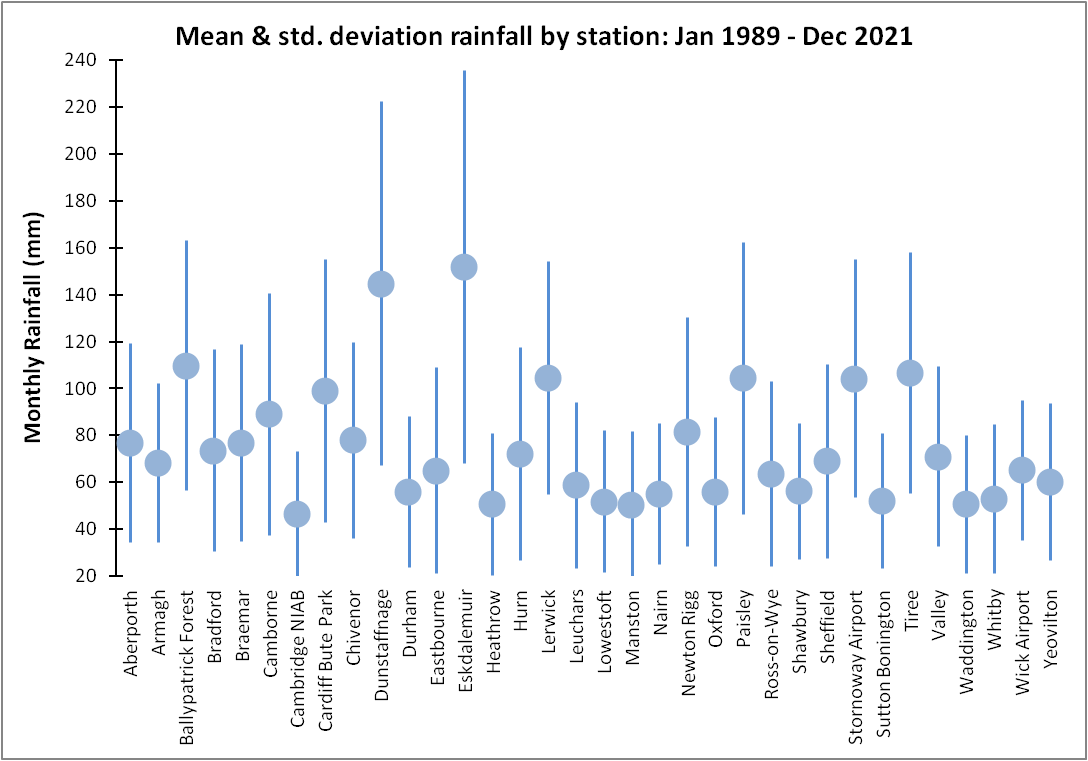
Some stations will run wetter than others and we may expect stations in the North to need bigger buckets. This is confirmed rather nicely by this plot of mean monthly rainfall over the comparative period of 1989–2021 when all 34 stations were continuously operative. The Scottish stations stand out a mile, especially Dunstaffnage and Eskdalemuir, though Cardiff Bute Park in Wales is also a good place to flog brollies along with Ballypatrick Forest in Northern Ireland:
Although I shall be producing a grand UK mean from these 34 stations it will be interesting to see how the wet stations have fared over time compared to dry. Equally, we may define station location as coastal or inland and see how these two regions compare over time; then there’s comparing rainfall in urban areas to rural locations - there’s a fair bit to squeeze out!
To kick us off on this adventure I decided to run a Pearson bivariate correlation for minimum, maximum, mean and standard deviation of monthly rainfall against station latitude, longitude and height AMSL for the reference period of 1989-2021. Herewith some interesting results:
We observe the strongest correlation between latitude and minimum monthly rainfall (r = 0.624, p<0.001, n=34). This may be summed up by saying it does nothing but rain up North! It does indeed rain more up North when it does rain, as witnessed by the statistically significant correlations with maximum and mean rainfall. Variation in rainfall, as summarised by the standard deviation for the period 1989-2021, failed to reach statistical significance at the 95% level of confidence (p=0.156).
There’s also a rather interesting East-West effect which may be summed by declaring more rain in the West (check out those statistically significant negative correlations for longitude and all four summary measures for rainfall). The correlation between longitude and standard deviation of rainfall is intriguing (r = -0.478, p=0.004, n=34) in that this indicates less variability in the rainfall pattern of the Eastern side of the UK.
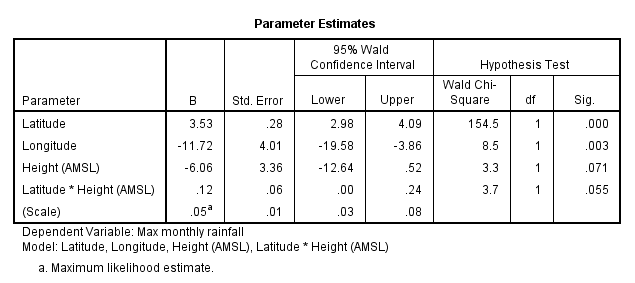
Station height (AMSL) yields a statistically significant correlation with maximum monthly rainfall (r = 0.463, p=0.006, n=34) and that’s yer lot. This result is to be expected, but may well be confounded by latitude (northern towns at greater altitude) so we better run a simple generalised linear model (GLM):
Ooooo awkward! The interactive term between height (AMSL) and latitude just hovers over borderline statistical significance at the 95% level of confidence (p=0.055), so there’s a suggestion of a possible confounding effect but only just!
Latitude comes out shouting with an estimate of an extra 3.53mm of maximum monthly rainfall with every degree of latitude (p<0.001) but it is the East-West effect that takes the biscuit with an extra 11.72mm of maximum monthly rainfall for every degree we travel West (p=0.003).
As we go along I shall be refining this model and using GLM plus a few other tools to explore relationships within the rainfall record.
Picky-wicky-doo-dah
This may all sound rather geeky and picky-wicky-doo-dah but I can assure you there is good reason for my fiddling and that is the plain and simple fact that no stations were ever created equal. Their location and the surrounding urban development over the years will impinge on precipitation patterns. Accounting for this will be important when we start to look at the turn of the last century and attempt to compare rainfall back then with rainfall in 2021.
For example, we’ve discovered that stations at Dunstaffnage and Eskdalemuir record serious amounts of rain each month. If we added them to the calculation for UK mean rainfall since the turn of the last century then the UK would appear to have suddenly got wetter in 1914 when Eskdalemuir came online, and again in 1972 when Dunstaffnage came online. Without knowing this had been done we may conjure all sorts of nefarious reasons and may try to pin the blame on climate change, but all that has happened is that we’ve put our national mean together in a sloppy manner.
In the next newsletter I shall produce a slide for mean monthly UK rainfall based on the ‘big five’(Armagh, Oxford, Stornoway Airport, Durham and Sheffield) whose impeccable records stretch back to 1900 and before. Until then…
Kettle On!


JD, A few months back I independently discovered the historical met office mini-series. Out of interest then, I thought there may be a way of discovering the urban heat island effect from analysing stations in some windy and remote stations such as Stornaway and others where the UHI effect would be negligible or non-existent. Now, you say “in a jiffy” you have the data in analysable form. OK, kudos, you obviously have a routine that converts their pdf type data into Excel type column format. I admit my attempts were pathetic and long-winded. Let’s put it down to my old age, Microsoft Excel input limitations (not to mention my not paying enough attention in my stats courses 50 years ago!). Thing is, I would love access to your converted data. I’m just going to potter here. A few graphs, searching for changes in recordings thermometers/sensors and location, i.e. has there been urbanisation around some sites? You know what I mean, all the stuff which pragmatic types like us just don’t gloss over. If you have a link to your tabulated data I would really love to download your stuff and have a play.
Peter Norman
2 min ago
It rains more in the west and in the north of the UK is a fact and if your statistical analysis confirm it. Enjoy a nights sleep without worry: There's no "gato encerrado" here. My worry is UK rainfall is so variable in any location you will have trouble finding any trend which might really and truly indicate a "climate change". We had the 1975-1976 drought issues and politicians did sweet fanny all to build more reservoirs. Planning for the increased population and the probable recurrence of future drought periods was just ignored/shelved. Hose pipe bans and water panic are therefore built into our future. Given that we use less than 2% of our rainfall, the fishes and sea creatures must be really happy with our 98% run-off with added nitrogen and minerals.
Reply
Delete
Collapse