

NSSTC v6.0 Temperature Anomaly Update (part 7)
NSSTC v6.0 Temperature Anomaly Update (part 7)
Satellites have the potential to offer the most accurate surface temperature data. In this series I analyse the latest data records from NSSTC/UAH (Lower Troposphere) for the period Dec 1978-Feb 2024.

I confess to being bugged by that inexplicable change in the nature of the HadSST4 sea surface temperature dataset that we saw back in part 6, so decided to probe it a little further before moving on to the Southern Hemisphere.
We can start out by considering the first order differential of the time series. This sounds fancy until we realise we’re simply looking at the month-on-month change in the SST anomaly over the period December 1978 – February 2024. Here is that series:
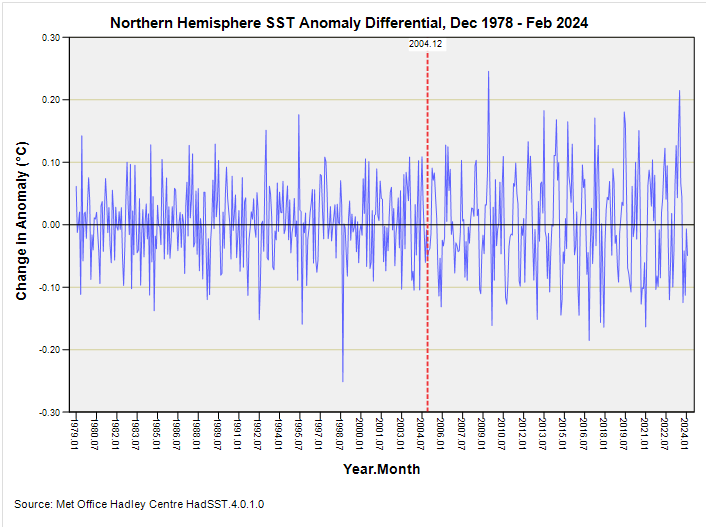
Do you see the difference more clearly now? I most certainly do and I have dropped a red dashed line down where the data flips from one pattern style to the next. This isn’t natural and is evidence of tampering, though this may be tampering in the sense of doing something different to process the data or collecting different types of data; that is to say there may be a valid reason why the time series leaps like this. Whatever was going on in the kitchens of the Hadley Centre back then resulted in the flipping of r…
Keep reading with a 7-day free trial
Subscribe to John Dee's Climate Normal to keep reading this post and get 7 days of free access to the full post archives.