
The Temperature Of The UK Over The Last 100 Years (part 9)
A butcher's at daily maxima and minima over the last 100 years. Are things getting worse, and what does ‘worse’ mean?

In this series so far I have focused on UK daily mean maximum and minimum temperatures as recorded at 34 weather stations since 1853, details of which may be found here. My experience is such that alarmists will respond with phrases like, “big deal, so what?”, or perhaps, “only 34, that’s nothing: they’re not likely to be representative of the global picture”. Hence today I’m going to determine if 34 UK weather stations is a big deal or not, and whether a small island sitting between a cold northerly sea and warmer ocean at latitude is capable of yielding anything worth spending cogitation time on.
What we need, then, is to get our hands on a highly reputable temperature dataset derived from land-based stations by a leading institution, and ideally one that feeds measurements into IPCC’s CMIP sausage machine. Whilst I could go to NASA, NOAA or Berkeley I decided to keep it Brit-flavoured and opted for the mighty CRUTEM5 anomaly series as concocted by the Climatic Research Unit at the University of East Anglia. Yes indeedy, that CRU/UEA that took a starring role in the climategate affair (p.s. don’t expect much truth on the matter to be told on Wiki).
Crusty CRUTEM
Now CRUTEM5 data are lovely stuff, being 1961-1990 normalised anomalies for the mean surface temperature as derived from a rather a large number of stations worldwide, and baked with a golden crust. You can pull down monthly or annual estimates going all the way back to 1850 and you can pull down estimates by hemisphere. For today’s recipe I am going to pull down the latest annual estimates for the northern hemisphere (CRUTEM.5.0.1.0).
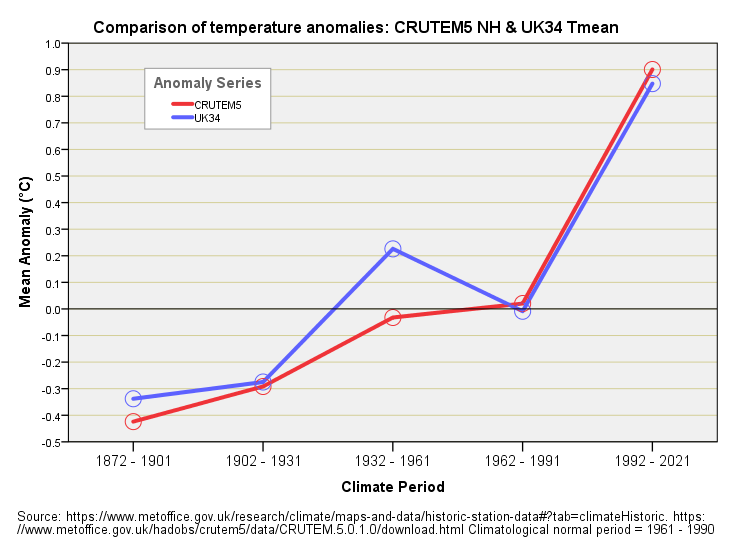
For the time being we are going to have to set aside the many controversial issues surrounding data capture, preparation and… ahem… ‘adjustment’ and take the series at face value. We are going to bung CRUTEM5 estimates in a time series plot along with the time series I have derived for tmax and tmin from my sample of 34 UK stations. There’s a little bit of jiggery-pokery involved in this in that I have to re-normalise my data series to correspond to the 1961-1990 climatological normal period instead of the 1991-2020 normal period, but that is a trivial matter. Get something to munch and have a look at this:
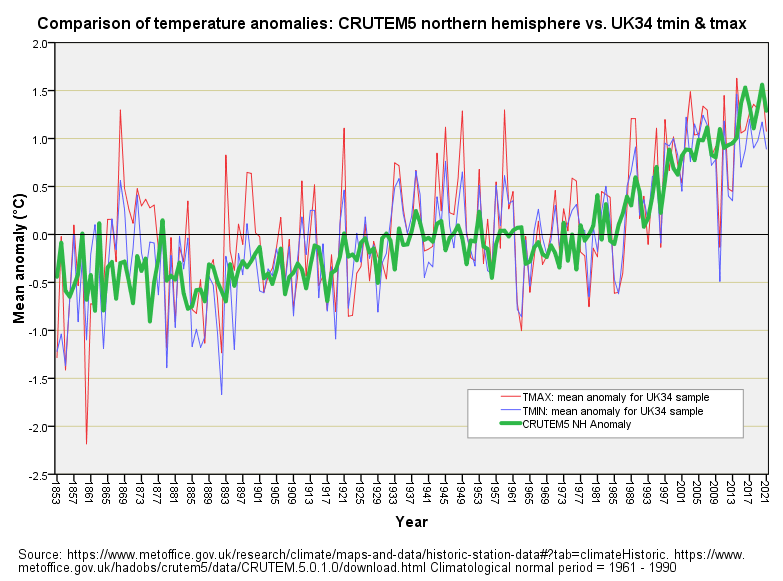
Now that is rather tasty! I am sure we can all agree on a remarkable correspondence, and I am sure we can all spot some interesting differences. The first thing that catches my eye is the variability inherent in the 34 station tmin and tmax series compared to the umpteen station, highly polished CRUTEM5; this is to be expected.
In order that we may better compare home-spun and big player data I took the liberty of calculating the UK34 tmean series and this is presented below:
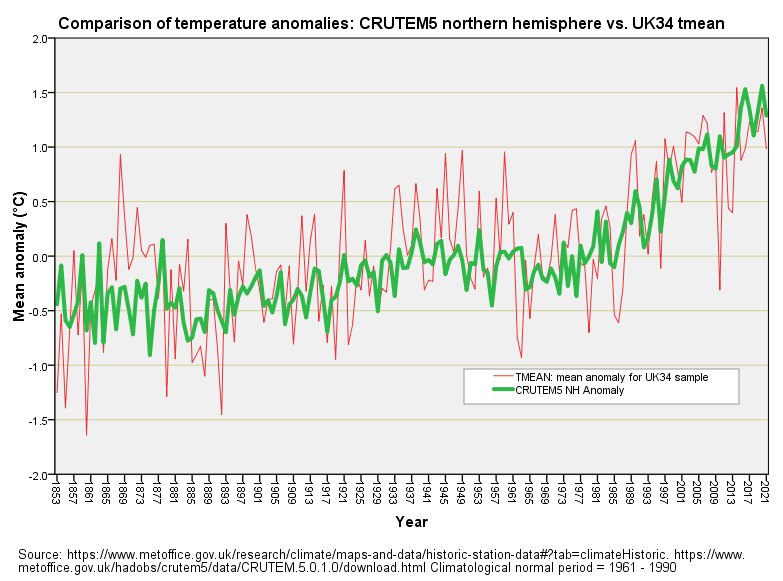
By and large this is a cracking match and means that a modest sample of 34 UK stations - cobbled together for the price of two and a half packets of biscuits - is capable of rendering estimates of the warming trend pretty much as good as a rather expensive state-of-the-art dataset. This is why I smile at sneering activists and simply get on with my work.
Hang On A Minute!
If we cogitate on this slide long enough we get to notice two discrepancies that are worthy of mention. Firstly, the period 1933-1961 appears to be running warmer for the UK34 station sample compared to CRUTEM5. Secondly, the period 1865-1877 appears to be running warmer at the UK34 station sample compared to CRUTEM5.
N.B. Similar discrepancies find their way into NASA, NOAA and Berkeley datasets of the same nature when compared with raw station records leading some analysts to accuse the big players of deliberately cooling the rather warm war years, and deliberately cooling the pre-industrial era to make the current era look bad. It is very easy to do this and I may well pen an article showing how this is done. The net effect of this fudge is to enhance post-industrial warming and to avoid the awkwardness of an inexplicably warm period during the ‘30s and ‘40s. Whatever your spin on this, here are discrepancies for all to see.
Fresh Eyeballs
I’ve been playing with different ways of presenting this finding and feel the clearest presentation is this error bar plot of decadal mean differences between the two data series:
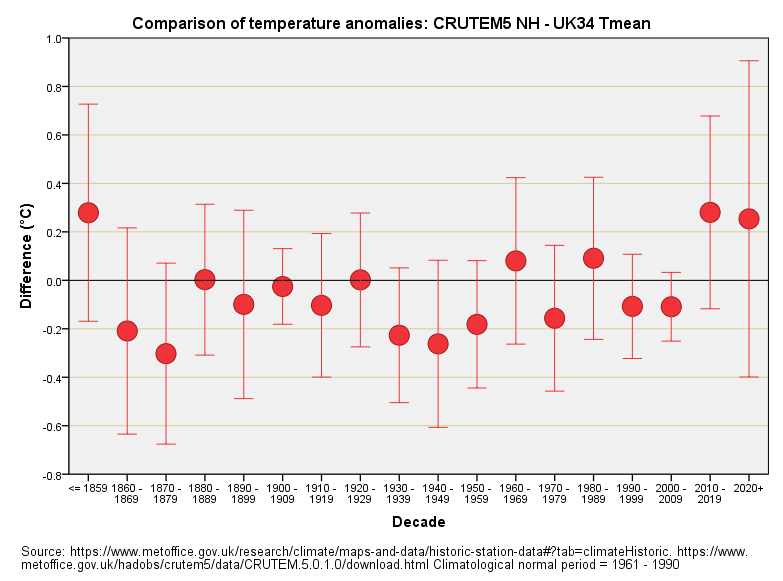
Blobs sitting above the zero value on the y-axis (vertical axis) represent decades where the mean differences are positive; that is to say where the CRUTEM5 mean annual anomaly record is consistently higher than the UK34 data as derived from raw station records. In plain English the crew at CRU are somehow making it hotter than it may very well have been. Blobs sitting below the zero value represent the crew at CRU somehow making things cooler than it may have been, though we must expect random scatter.
Thinking Cap
If we put our thinking cap on we should proclaim that we’d see differences between these two series but that these differences should fall into a random(ish) pattern. That’s not what we seem to see. What we seem to see are two rather warm recent decades and a bunch of cool decades embracing WWII and its aftermath – but could this be Joe Random playing tricks with our eyeballs? To answer this we better analyse 169 annual mean differences rather than just 18 decadal mean differences.
Here’s one I baked earlier:
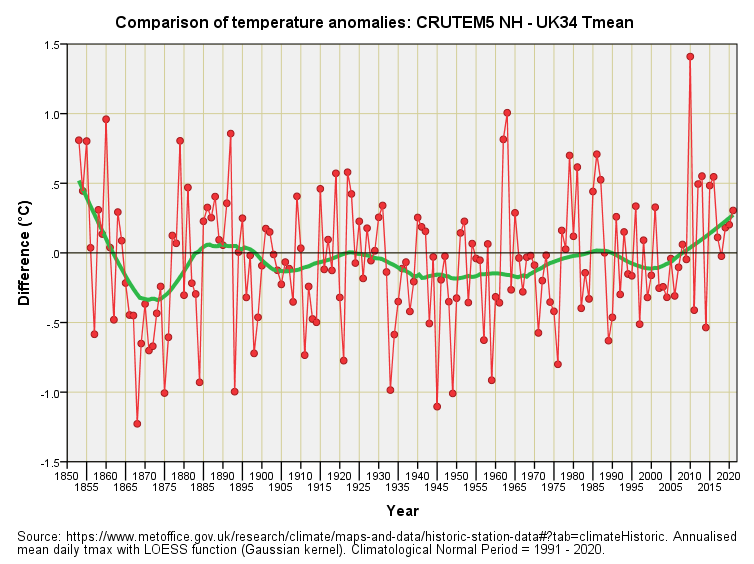
The wriggly snake that represents a LOESS regression reveals a distinct downward kink from 1860-1880 and a bendy trend upward since 1965 or thereabouts. Is this series what stats bods call a random walk? Computer says “maybe” or, rather more specifically, a nonparametric test for randomness (Wald–Wolfowitz runs test) returns a p-value of p=0.054, so we might be looking at randomness playing tricks and we may not.
I thought I’d settle the matter by taking the 90-year period of 1932-2021 and running this through a quick linear regression to see if I could detect any underlying trend in bias. I could indeed, with a positive slope of representing a differential that has been growing by 0.05°C per decade (p=0.003). This begs the question of why the CRUTEM5 mean annual anomaly is diverging from the UK34 raw station record over time such that it shows greater and greater warming relative to raw station records. Are they cooking the books or can we explain this away in a decent fashion?
Even-handed ANOVA
Trying to be an even-handed sort of chap I’m going to assume the latter and put this differing differential down to dips in the UK34 tmean record that don’t appear in the super-smooth CRUTEM5 series – these are clearly evident in my second slide. I thus decided to wheel out the spanner called univariate analysis of variance (ANOVA) and run both CRUTEM5 and UK34 tmean anomalies through some classic analysis to see whether we could detect differences between series for each climate phase. This yielded some rather interesting results, the meat and potatoes of which are presented below:
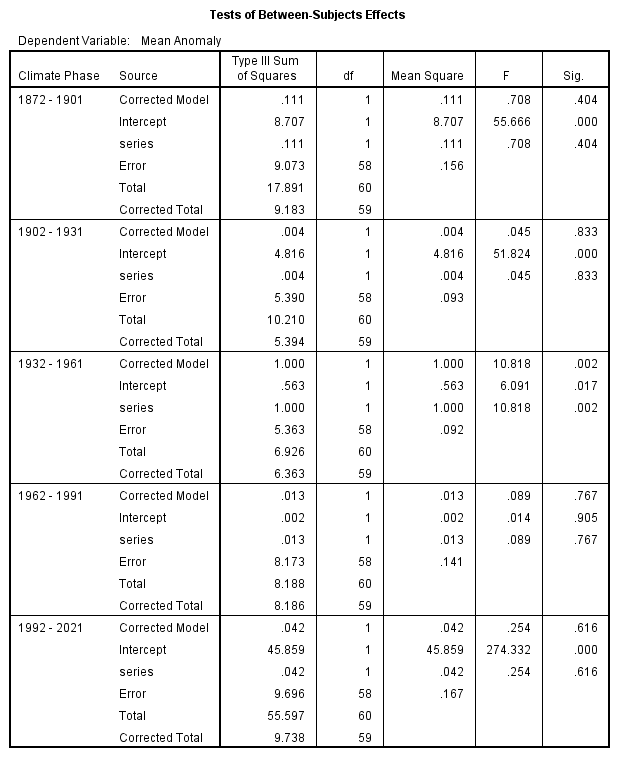
The critical result is contained in the variance source labelled ‘series’ for this is the factor that distinguishes between anomalies. We find only one statistically significant difference and that is for the period 1932-1961 (p=0.002), in which we find an overall mean anomaly of -0.032 for CRUTEM5 estimates and +0.226 for UK34 estimates. Now that is some difference and indicates that the CRUTEM5 record has likely been massaged to remove trace of significant warming between 1932 and 1961.
We may conclude that the CRU crew are into cooking books in a subtle and directed manner rather than making-up a whole tray of sugar-coated fiction.
Those who like graphs may wish to contemplate this simple but satisfying sizzler that summarises what I’ve just said:
Once upon a time we’d smack bottoms and sent people to bed without supper. These days naughty folk get fat grants and praise for scientific sleight of hand.
Kettle On!