
Antarctic Sea Surface Temperature (part 2)
The relationship between sea surface temperature (60 – 90° South) and sea ice extent isn’t as straightforward as we may expect

Now that we have the most robust time series I can muster we ought to stop asking awkward questions about data collection take a look at the relationship with Antarctic sea ice extent. Long gone are the days when I got a straightforward answer in the field of climate science, and so I wasn’t expecting anything but puzzlement once more. I wasn’t to be disappointed – grab a slice of cake and have a cogitate on this scatterplot for annual means gathered over the period 1979 – 2022:

The Pearson bivariate correlation coefficient for this scatter fetches up at r = -0.436 (p=0.003, n=44). Yes indeed, we have evidence of an overall negative relationship as we may expect (warmer oceans mean less ice), but that green LOESS function indicates the situation isn’t that simple, with SST anomalies from 0.00 to +0.35°C revealing total lack of a relationship. So what is going?
This is what is going on…
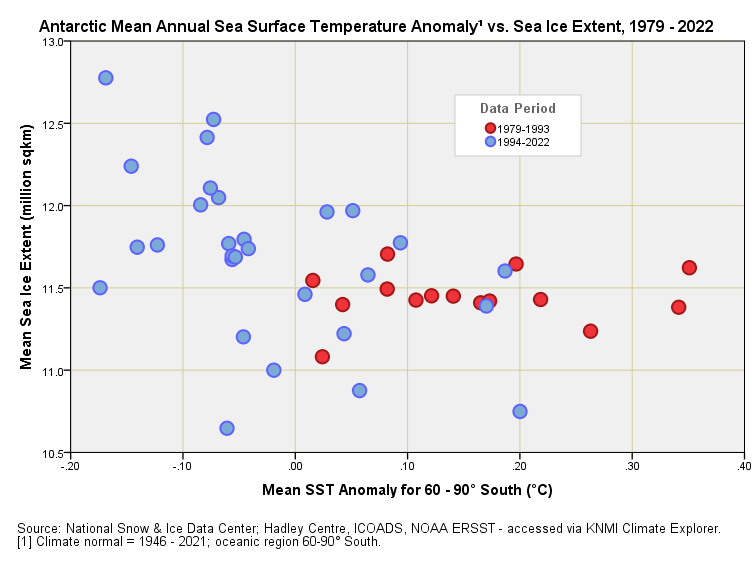
Over the fifteen-year period 1979 – 1993 we do not observe a relationship between mean annual sea ice extent and mean annual sea surface temperature anomaly for oceans in the region 60 – 90° South. In statistical parlance we would claim that these two variables are independent. In the real world this doesn’t make sense so something else must be going on. Either those early estimates of SST are too warm (we need to push the red blobs to the left) or those early estimates of sea ice are too high (we need to push the red blobs down).
Both possibilities are also possible, and then there’s that awkward question of homogeneity that I brought up in part 1 of this series… could we be looking at two different geological processes? My thinking here is that back in 1979 – 1993 sea ice was so thick that it didn’t respond as much to changes in sea surface temperature, but then again I’m no ice expert! Whatever the explanation what we seem to have are two different ice eras, and we may get into all manner of numerical trouble if we treat them as identical.
A Solar Signal?
There are a number of ways we can hack at this puzzle and one of my favourite spanners is use of cross correlation. If I run cross correlation for SST with SIE I get this fascinating plot:
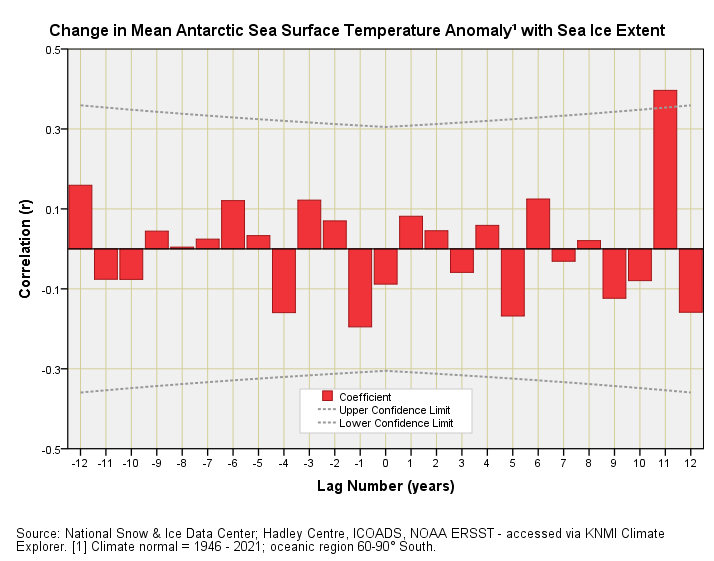
Note that the word ‘change’ in the title indicates we are looking at the year-on-year change (first order differential) in mean SST with SIE, as opposed to the absolute annual values. This is an important consideration for if two totally unrelated data series are rising and falling in time then they will always strongly correlate even if that correlation possesses no meaning. My favourite example of this is the correlation between deaths by swimming pool drownings and films starring Nicholas Cage. I did bump into Nicholas Cage once (literally) but that’s another story for another day!
This awkwardness (meaning meaningless correlation rather than smacking into Nicholas Cage) is why time series bods resort to using the first order differential, the reason being that if two data series are genuinely causally related, then any incremental change in one should be mirrored in incremental change in the other. In plain English, if the ocean warms between two years then we’d expect less ice between those same two years, and if the ocean cools we’d expect more ice. This is not what we see!
What we should be seeing is a large negative-going red bar at lag zero or perhaps at lag +1 or even +3 years, indicating a delay in the subsequent melt. We see nothing of the sort, or indeed anything anywhere near approaching this, which suggests that Antarctic sea ice extent is not shrinking or growing directly as a result warming or cooling surrounding seas. To say this result puzzled me is an understatement! Not only that but the relationship we do see is a positive one (warmer seas produce more sea ice) after a lag of 11 years... how solar cycle is that?!!
This is truly astonishing and I am going to have to park the result right there for a while whilst I cogitate. Meanwhile, I’ll go dig some data up for Antarctic land surface temperature. This promises to be a real doozy. Not only will Antarctica bamboozle us but we shall discover a few of the dirty tricks being played by institutionalised experts and the alarmist media.
Kettle On!