

Climate Change & Climate Variability (part 1)
Climate Change & Climate Variability (part 1)
Hot weather is due to CO2. Cold weather is due to CO2. Heavy rain is due to CO2. Drought is due to CO2. Today I look at the variance inherent in the HadCRUT5 global mean temperature.

It’s a funny old world. As a young thing the big climate scare hitting the front page of all the important publications was an impending ice age. Scientists were pretty certain about this and they blamed the beginnings on instability of the jet stream. Yep, that’s right, the same instability that they have recently adopted to explain global warming. Global warming didn’t pan out as planned despite some very good efforts at data tampering, and so we got lumbered with the catch-all of Climate Change.
This was a very shrewd move because pretty much anything and everything could be blamed on what are essentially unpredictable weather events. In the near future I’m expecting UK folk to put their umbrellas up and exclaim that it is climate changing a great deal today! Equally, those managing to find a spot on Blackpool sands on a sunny August bank holiday will be rubbing sun tan oil into torsos and exclaiming that it is climate changing a great deal today!
Laugh we might but one friend has already reported the following conversation between two people during a period of heavy rain down here in the West Country where rain is an integral part of life:
Person A: “Oh, no, it’s that bloody climate change!”
Person B: “No, it’s just raining like it always does.”
There you go. Programming is in full swing, and those who are easily programmed tend to be those who fail to realise it… but that's another tall story for another day from back when I was formulating my neurobiology PhD.
So what to do with a concept as slippery and ill-defined as climate change? Well, the statistician in me realised we are essentially talking about variance when we witter on about climate change. Everybody understands what is meant by the average of something (a.k.a. mean) and you’ll see these values splattered all over anything related to climate. We’ve got mean rainfall, mean sea level, mean hours of sunshine, mean cloud cover and, of course, mean temperature (amongst a zillion other things). Yet this is only one half of the statistical picture, for with each calculated mean there comes another property and that is the variance, this property of the data sample being intimately related to the standard deviation and the standard error. If climate change is indeed a thing then we are going to see variance rising over time in pretty much any measure we care to… er… measure. Here’s my crafty idea in a nutshell:
‘Climate Change’ by its very definition implies magnification of the variance inherent in any climate-related variable over time, and this can be assessed using formal statistical methods.
So let’s jump into the deep end with the variable that dominates pretty much every media headline: temperature.
Variance In Global Temperature
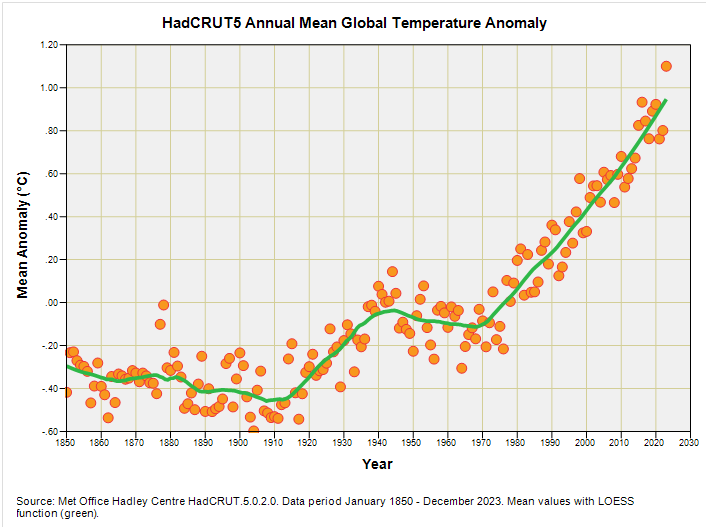
For this tray bake I am going to use our old friend the HadCRUT5 global temperature anomaly. Keen readers can obtain this data for themselves via this link. This state-of-the-art dataset offers monthly values that get going in January 1850, with the latest records showing for March 2024 at the time of writing.
What I am going to do with these 2,091 monthly records is boil them down into annual means and their standard deviation then throw 2024 in the bin so that we’re looking at 174 wholesome and fully ripe years only. Let us start straight in with a very familiar slide:
Keep reading with a 7-day free trial
Subscribe to John Dee's Climate Normal to keep reading this post and get 7 days of free access to the full post archives.